
Can this work on MTF?Many thanks for your help Antwerks. If I want to now add a scan for a selling opportunity, what do I change?
You are using an out of date browser. It may not display this or other websites correctly.
You should upgrade or use an alternative browser.
You should upgrade or use an alternative browser.
GHLA SuperTrend CCI HighLow Activator For ThinkOrSwim
- Thread starter cando13579
- Start date
Gon Fishin
New member
Sorry to go a bit off topic here - can I ask what you are using to plot the Support / Resistance lines in the main chart body of the original attachment? I like the look of that & would like to try it out.GHLA SuperTrend CCI High-Low Activator Oscillator
A multi-layered trend and momentum indicator that combines Gann-inspired high/low levels, a SuperTrend mechanism, and a custom CCI oscillator. It provides dynamic entry and exit signals, confirming bullish or bearish trends while filtering out market noise. The accompanying oscillator visually represents trend strength and direction, allowing traders to quickly identify opportunities and avoid indecision zones.
View attachment 26314
Code:# GHLA_SuperTrend_CCI_High_Low_Activator_Oscillator #By CANDO13579 declare lower; declare real_size; input ghlaPeriod = 10; input stPeriod = 14; input stShiftTicks = 20.0; input useFilter = yes; def minTick = TickSize(); def shift = stShiftTicks * minTick; # ----------------------------- # GHLA Logic # ----------------------------- def ghlaAvgH = Average(high, ghlaPeriod); def ghlaAvgL = Average(low, ghlaPeriod); def sw = if close > ghlaAvgH then 1 else if close < ghlaAvgL then -1 else 0; def ghlaDir = CompoundValue(1, if sw != 0 then sw else ghlaDir[1], 0); def ghlaLevel = if ghlaDir < 0 then ghlaAvgH else ghlaAvgL; # ----------------------------- # Custom CCI using Typical Price # ----------------------------- def tp = (high + low + close) / 3; def tpSMA = Average(tp, stPeriod); def meanDev = Average(AbsValue(tp - tpSMA), stPeriod); def cciValue = if meanDev == 0 then 0 else (tp - tpSMA) / (0.015 * meanDev); # ----------------------------- # SuperTrend State Machine # ----------------------------- # stFlag: 1=long, -1=short rec stFlag = if IsNaN(stFlag[1]) then if cciValue >= 0 then 1 else -1 else if cciValue > 0 and stFlag[1] <= 0 then 1 else if cciValue < 0 and stFlag[1] >= 0 then -1 else stFlag[1]; rec st = if IsNaN(st[1]) then if cciValue >= 0 then low - shift else high + shift else if cciValue > 0 and stFlag[1] <= 0 then low - shift else if cciValue < 0 and stFlag[1] >= 0 then high + shift else if stFlag > 0 and (low - shift) > st[1] then low - shift else if stFlag < 0 and (high + shift) < st[1] then high + shift else if useFilter and stFlag > 0 and st[1] < st[1] and (close < open or high < high[1]) then st[1] else if useFilter and stFlag < 0 and st[1] > st[1] and (close > open or low > low[1]) then st[1] else st[1]; # ----------------------------- # signals # ----------------------------- def notNaST = !IsNaN(st); def upSignal = notNaST and close > st and close > ghlaLevel; def downSignal = notNaST and close < st and close < ghlaLevel; def neutralSignal = notNaST and !upSignal and !downSignal; # ----------------------------- # Output (centered) # ----------------------------- def signalCenter = 0; plot Sig = signalCenter; Sig.SetPaintingStrategy(PaintingStrategy.HORIZONTAL); Sig.SetLineWeight(4); Sig.AssignValueColor( if upSignal then Color.GREEN else if downSignal then Color.RED else Color.LIGHT_GRAY ); # Boundary reference lines # ----------------------------- plot UpperLine = 1; UpperLine.SetDefaultColor(Color.DARK_GRAY); UpperLine.SetStyle(Curve.SHORT_DASH); plot LowerLine = -1; LowerLine.SetDefaultColor(Color.DARK_GRAY); LowerLine.SetStyle(Curve.SHORT_DASH); # Gann High/Low Activator Oscillator input activatorPeriod = 14; # Calculate simple moving averages def avgHigh = Average(high, activatorPeriod); def avgLow = Average(low, activatorPeriod); # Determine state def bullState = close > avgHigh; def bearState = close < avgLow; # Track the last valid state def lastState = CompoundValue(1, if bullState then 1 else if bearState then -1 else lastState[1], 0); def avgRange = avgHigh - avgLow; def oscillator = if avgRange != 0 then if lastState == 1 then (close - avgLow) / avgRange else if lastState == -1 then (close - avgHigh) / avgRange else 0.5 else 0.5; # Plot oscillator plot GannOsc = oscillator; GannOsc.SetLineWeight(2); GannOsc.AssignValueColor( if lastState == 1 then CreateColor(0, 255, 0) # Green else if lastState == -1 then CreateColor(255, 165, 0) # Orange else Color.GRAY ); # Plot midline plot MidLine = 0.5; MidLine.SetDefaultColor(Color.LIGHT_GRAY); MidLine.SetStyle(Curve.SHORT_DASH);
You can find the link on post #11 @Gon FishinSorry to go a bit off topic here - can I ask what you are using to plot the Support / Resistance lines in the main chart body of the original attachment? I like the look of that & would like to try it out.
Respbid6077
New member
ThanksHi ,do not know if this is what you expected but ,try this.
View attachment 26524
Code:declare upper; declare real_size; input ghlaPeriod = 10; input stPeriod = 14; input stShiftTicks = 20.0; input useFilter = yes; input activatorPeriod = 14; def minTick = TickSize(); def shift = stShiftTicks * minTick; # ----------------------------- # GHLA Logic # ----------------------------- def ghlaAvgH = Average(high, ghlaPeriod); def ghlaAvgL = Average(low, ghlaPeriod); def sw = if close > ghlaAvgH then 1 else if close < ghlaAvgL then -1 else 0; def ghlaDir = CompoundValue(1, if sw != 0 then sw else ghlaDir[1], 0); def ghlaLevel = if ghlaDir < 0 then ghlaAvgH else ghlaAvgL; # ----------------------------- # Custom CCI using Typical Price # ----------------------------- def tp = (high + low + close) / 3; def tpSMA = Average(tp, stPeriod); def meanDev = Average(AbsValue(tp - tpSMA), stPeriod); def cciValue = if meanDev == 0 then 0 else (tp - tpSMA) / (0.015 * meanDev); # ----------------------------- # SuperTrend State Machine # ----------------------------- rec stFlag = if IsNaN(stFlag[1]) then if cciValue >= 0 then 1 else -1 else if cciValue > 0 and stFlag[1] <= 0 then 1 else if cciValue < 0 and stFlag[1] >= 0 then -1 else stFlag[1]; rec st = if IsNaN(st[1]) then if cciValue >= 0 then low - shift else high + shift else if cciValue > 0 and stFlag[1] <= 0 then low - shift else if cciValue < 0 and stFlag[1] >= 0 then high + shift else if stFlag > 0 and (low - shift) > st[1] then low - shift else if stFlag < 0 and (high + shift) < st[1] then high + shift else if useFilter and stFlag > 0 and st[1] < st[1] and (close < open or high < high[1]) then st[1] else if useFilter and stFlag < 0 and st[1] > st[1] and (close > open or low > low[1]) then st[1] else st[1]; # ----------------------------- # signals # ----------------------------- def notNaST = !IsNaN(st); def upSignal = notNaST and close > st and close > ghlaLevel; def downSignal = notNaST and close < st and close < ghlaLevel; def neutralSignal = notNaST and !upSignal and !downSignal; # ----------------------------- # Output (centered) # ----------------------------- def signalCenter = 0; plot Sig = signalCenter; Sig.SetPaintingStrategy(PaintingStrategy.HORIZONTAL); Sig.SetLineWeight(4); Sig.AssignValueColor( if upSignal then Color.GREEN else if downSignal then Color.RED else Color.LIGHT_GRAY ); # Boundary reference lines # ----------------------------- plot UpperLine = 1; UpperLine.SetDefaultColor(Color.DARK_GRAY); UpperLine.SetStyle(Curve.SHORT_DASH); plot LowerLine = -1; LowerLine.SetDefaultColor(Color.DARK_GRAY); LowerLine.SetStyle(Curve.SHORT_DASH); # Gann High/Low Activator Oscillator # Calculate simple moving averages def avgHigh = Average(high, activatorPeriod); def avgLow = Average(low, activatorPeriod); # Determine state def bullState = close > avgHigh; def bearState = close < avgLow; # Track the last valid state def lastState = CompoundValue(1, if bullState then 1 else if bearState then -1 else lastState[1], 0); def avgRange = avgHigh - avgLow; def oscillator = if avgRange != 0 then if lastState == 1 then (close - avgLow) / avgRange else if lastState == -1 then (close - avgHigh) / avgRange else 0.5 else 0.5; # Plot oscillator plot GannOsc = oscillator; GannOsc.SetLineWeight(2); GannOsc.AssignValueColor( if lastState == 1 then CreateColor(0, 255, 0) # Green else if lastState == -1 then CreateColor(255, 165, 0) # Orange else Color.GRAY ); # Plot midline plot MidLine = 0.5; MidLine.SetDefaultColor(Color.LIGHT_GRAY); MidLine.SetStyle(Curve.SHORT_DASH); # ----------------------------- # Vertical lines on oscillator crosses # ----------------------------- # Detect midline crosses def crossAbove = oscillator crosses above MidLine; def crossBelow = oscillator crosses below MidLine; # Add vertical lines on crosses AddVerticalLine(crossAbove, "", Color.CYAN, Curve.SHORT_DASH); AddVerticalLine(crossBelow, "", Color.MAGENTA, Curve.SHORT_DASH); # Optional: Add labels at top of chart for better visibility #AddChartBubble(crossAbove, high, "Cross Above", Color.CYAN, yes); #AddChartBubble(crossBelow, high, "Cross Below", Color.MAGENTA, yes);
Here
Proven? In what way?Here is a run down on the indicator. The indicator is in the VIP section. Join VIP for this and a myriad of other great proven scripts.
Horizontal Line (Signal Line)
This is a thick horizontal line at 0 on the oscillator pane:
This line shows trend bias at a glance — it's not moving; the color is what changes to indicate market trend shifts.
- Color meanings:
- Green: Indicates a bullish condition (price is strong).
- Red: Indicates a bearish condition (price is weak).
- Gray: Neutral – no clear bullish or bearish trend.
Oscillator Line (Gann Oscillator)
This is the actual dynamic line that moves between 0 and 1:
What it represents:
How to read it:
- It's a normalized measure of price strength, calculated based on where the close sits between a moving average of highs and lows.
- It tells you how strong bulls or bears are, depending on where the line is relative to 0.5 (the center).
What happens when the oscillator crosses 0.5?
- Above 0.5 → bullish momentum.
- Below 0.5 → bearish momentum.
- The higher above 0.5, the stronger the bull trend.
- The lower below 0.5, the stronger the bear trend.
This is a momentum shift signal:
It’s often used as a confirmation that a trend is beginning or strengthening.
- Crossing above 0.5 → shift from bear to bull bias.
- Crossing below 0.5 → shift from bull to bear bias.
Right-hand Axis Values
The numbers along the right side of the oscillator pane typically range between 0 and 1, showing the current oscillator value.
Key levels:
You’ll also see lines at standard deviation levels, like:
- 0.5 = Neutral (centerline).
- 1 = Max bull strength.
- 0 = Max bear strength.
Zone Interpretation (based on colors and zones)
- UpperLine1 / UpperLine2 (usually red): Overbought levels (e.g., 0.85, 0.9+)
- LowerLine1 / LowerLine2 (usually green): Oversold levels (e.g., 0.15, 0.1-)
The oscillator has zones like:
Summary
Zone Name Meaning Color Overbought 2σ Very strong — might be overextended Red Overbought 1.5σ Strong bullish, potential topping Red Oversold 1.5σ Bearish pressure, possible bottoming Green Oversold 2σ Extremely oversold — reversal possible Green In Range Normal price action Gray
Tip for New Users
- Color of horizontal line = current trend bias (green/red/gray).
- Oscillator line = price strength, moves dynamically between 0–1.
- Crossing 0.5 = momentum shift.
- Right axis values = actual oscillator values.
- Overbought/Oversold clouds = zones to watch for reversals or overextensions.
Look for alignment between:
You're on the right path, understanding these tools takes time, but you're already ahead by asking the right questions.
- Green oscillator AND green horizontal line = strong bull trend
- Red oscillator AND red line = strong bear trend
- Oscillator bouncing off overbought/oversold zones = possible reversals
Proven? In what way?
@antwerks is a key VIP contributor, who provides an in-depth range of proofing studies:
https://usethinkscript.com/search/2...&c[title_only]=1&c[users]=antwerks&o=date&g=1

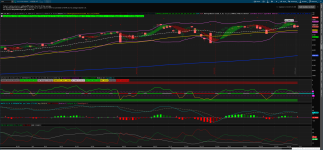
This is fantastic and extremely helpful!! THANK YOU for finding time to explain in detail. I find a lot of value in a comprehensive indicator. One follow on question...I attached a screenshot of SPX. If I understand correctly, the magnitude of the oscillator line (i.e. 2.0 & -2.6 in the attached screenshot) is an indication of the strength of the trend. Is that correct? Thanks again @antwerks . You were extremely helpful.Horizontal Line (Signal Line)
This is a thick horizontal line at 0 on the oscillator pane:
This line shows trend bias at a glance — it's not moving; the color is what changes to indicate market trend shifts.
- Color meanings:
- Green: Indicates a bullish condition (price is strong).
- Red: Indicates a bearish condition (price is weak).
- Gray: Neutral – no clear bullish or bearish trend.
Oscillator Line (Gann Oscillator)
This is the actual dynamic line that moves between 0 and 1:
What it represents:
How to read it:
- It's a normalized measure of price strength, calculated based on where the close sits between a moving average of highs and lows.
- It tells you how strong bulls or bears are, depending on where the line is relative to 0.5 (the center).
What happens when the oscillator crosses 0.5?
- Above 0.5 → bullish momentum.
- Below 0.5 → bearish momentum.
- The higher above 0.5, the stronger the bull trend.
- The lower below 0.5, the stronger the bear trend.
This is a momentum shift signal:
It’s often used as a confirmation that a trend is beginning or strengthening.
- Crossing above 0.5 → shift from bear to bull bias.
- Crossing below 0.5 → shift from bull to bear bias.
Right-hand Axis Values
The numbers along the right side of the oscillator pane typically range between 0 and 1, showing the current oscillator value.
Key levels:
You’ll also see lines at standard deviation levels, like:
- 0.5 = Neutral (centerline).
- 1 = Max bull strength.
- 0 = Max bear strength.
Zone Interpretation (based on colors and zones)
- UpperLine1 / UpperLine2 (usually red): Overbought levels (e.g., 0.85, 0.9+)
- LowerLine1 / LowerLine2 (usually green): Oversold levels (e.g., 0.15, 0.1-)
The oscillator has zones like:
Summary
Zone Name Meaning Color Overbought 2σ Very strong — might be overextended Red Overbought 1.5σ Strong bullish, potential topping Red Oversold 1.5σ Bearish pressure, possible bottoming Green Oversold 2σ Extremely oversold — reversal possible Green In Range Normal price action Gray
Tip for New Users
- Color of horizontal line = current trend bias (green/red/gray).
- Oscillator line = price strength, moves dynamically between 0–1.
- Crossing 0.5 = momentum shift.
- Right axis values = actual oscillator values.
- Overbought/Oversold clouds = zones to watch for reversals or overextensions.
Look for alignment between:
You're on the right path, understanding these tools takes time, but you're already ahead by asking the right questions.
- Green oscillator AND green horizontal line = strong bull trend
- Red oscillator AND red line = strong bear trend
- Oscillator bouncing off overbought/oversold zones = possible reversals
Attachments
Last edited by a moderator:
This is fantastic and extremely helpful!! THANK YOU for finding time to explain in detail. I find a lot of value in a comprehensive indicator. One follow on question...I attached a screenshot of SPX. If I understand correctly, the magnitude of the oscillator line (i.e. 2.0 & -2.6 in the attached screenshot) is an indication of the strength of the trend. Is that correct? Thanks again @antwerks . You were extremely helpful.
You're absolutely right in your interpretation — and this is a very robust multi-layered oscillator that blends:
- CCI trend logic (confirmation)
- Gann High/Low Activator (momentum + volatility envelope)
- Statistical boundaries (standard deviation zones)
- And a combined signal forecast engine.
Let’s walk through the meaning of the oscillator value (like +2.0 or -2.6) and how to interpret the entire setup:
The GannOsc line is calculated based on:
(close - avgLow) / (avgHigh - avgLow)
or its inverse if in a bearish state.
Then it’s plotted along with statistical bands:
- Regression line (Inertia)
- ±1.5σ and ±2σ bounds (standard deviations)
- +2.0 or higher → price is well above the regression average; strongly overbought
- -2.6 or lower → price is well below the average; strongly oversold
- ~0.5 → mean reversion, mid-zone, often seen during consolidation
| Oscillator Value | Interpretation |
| > +2.0 | Extreme overbought — potential exhaustion, watch for reversal |
| +1.5 to +2.0 | Overbought zone — may still trend, but risk rising |
| +0.5 to +1.5 | Healthy uptrend — bullish confirmation |
| ~0.5 | Neutral zone — no edge, often chop |
| -0.5 to -1.5 | Healthy downtrend — bearish confirmation |
| -1.5 to -2.0 | Oversold zone — trending or weakening sellers |
| < -2.0 | Extreme oversold — watch for potential reversal |
Why This Is More Than Just an Oscillator
This script doesn't just show trend strength — it uses a state machine to interpret multiple layers:
1. Trend Direction
Based on:
CCI (for direction)
SuperTrend + High/Low Activator filters
2. Momentum & Volatility Zone
- Are we trending inside or outside expected statistical range?
Looks at the combination of:
- Signal direction
- Oscillator’s zone
- Labels like:
- "Strong BUY Zone" (uptrend + deep oversold)
- "Buying Opportunity" (trend + normal dip)
- "Selling Opportunity" (trend + pullback)
- "Wait / Watch" (no alignment or chop)
Yes — you understand it correctly. A Gann oscillator value of +2.0 or -2.6 tells you:
We are statistically outside normal price behavior, in strong trending or extended conditions.
Combined with the trend logic and signal forecast, this gives you:
- Clear trade bias
- Dynamic risk awareness
- Early signals when trend strengthens or weakens
Last edited by a moderator:
sorry for my delay but was not aware of your question. i don't recall now enough to answer. i will try to do that (I am old) and if memory comes back, I'll get back to you.Hi ,care to explain what 3 sections, Are you referring to?.
This script looks great! Good signals when price crosses above or below the line. How do I scan for a cross above (bull) and also below ( bear) the line ?Here the script with the 2 additional parts by @chewie76 and @antwerks ,thank you.

Code:# GHLA_SuperTrend_CCI_High_Low_Activator_Oscillator #By CANDO13579 #STDEV zones by Chewie76 #Oscillator Range Analysis Labels by Antwerks declare lower; declare real_size; input ghlaPeriod = 10; input stPeriod = 14; input stShiftTicks = 20.0; input useFilter = yes; def minTick = TickSize(); def shift = stShiftTicks * minTick; # ----------------------------- # GHLA Logic # ----------------------------- def ghlaAvgH = Average(high, ghlaPeriod); def ghlaAvgL = Average(low, ghlaPeriod); def sw = if close > ghlaAvgH then 1 else if close < ghlaAvgL then -1 else 0; def ghlaDir = CompoundValue(1, if sw != 0 then sw else ghlaDir[1], 0); def ghlaLevel = if ghlaDir < 0 then ghlaAvgH else ghlaAvgL; # ----------------------------- # Custom CCI using Typical Price # ----------------------------- def tp = (high + low + close) / 3; def tpSMA = Average(tp, stPeriod); def meanDev = Average(AbsValue(tp - tpSMA), stPeriod); def cciValue = if meanDev == 0 then 0 else (tp - tpSMA) / (0.015 * meanDev); # ----------------------------- # SuperTrend State Machine # ----------------------------- # stFlag: 1=long, -1=short rec stFlag = if IsNaN(stFlag[1]) then if cciValue >= 0 then 1 else -1 else if cciValue > 0 and stFlag[1] <= 0 then 1 else if cciValue < 0 and stFlag[1] >= 0 then -1 else stFlag[1]; rec st = if IsNaN(st[1]) then if cciValue >= 0 then low - shift else high + shift else if cciValue > 0 and stFlag[1] <= 0 then low - shift else if cciValue < 0 and stFlag[1] >= 0 then high + shift else if stFlag > 0 and (low - shift) > st[1] then low - shift else if stFlag < 0 and (high + shift) < st[1] then high + shift else if useFilter and stFlag > 0 and st[1] < st[1] and (close < open or high < high[1]) then st[1] else if useFilter and stFlag < 0 and st[1] > st[1] and (close > open or low > low[1]) then st[1] else st[1]; # ----------------------------- # signals # ----------------------------- def notNaST = !IsNaN(st); def upSignal = notNaST and close > st and close > ghlaLevel; def downSignal = notNaST and close < st and close < ghlaLevel; def neutralSignal = notNaST and !upSignal and !downSignal; # ----------------------------- # Output (centered) # ----------------------------- def signalCenter = 0; plot Sig = signalCenter; Sig.SetPaintingStrategy(PaintingStrategy.HORIZONTAL); Sig.SetLineWeight(4); Sig.AssignValueColor( if upSignal then Color.GREEN else if downSignal then Color.RED else Color.LIGHT_GRAY ); # Boundary reference lines # ----------------------------- plot UpperLine = 1; UpperLine.SetDefaultColor(Color.DARK_GRAY); UpperLine.SetStyle(Curve.SHORT_DASH); plot LowerLine = -1; LowerLine.SetDefaultColor(Color.DARK_GRAY); LowerLine.SetStyle(Curve.SHORT_DASH); # Gann High/Low Activator Oscillator input activatorPeriod = 14; # Calculate simple moving averages def avgHigh = Average(high, activatorPeriod); def avgLow = Average(low, activatorPeriod); # Determine state def bullState = close > avgHigh; def bearState = close < avgLow; # Track the last valid state def lastState = CompoundValue(1, if bullState then 1 else if bearState then -1 else lastState[1], 0); def avgRange = avgHigh - avgLow; def oscillator = if avgRange != 0 then if lastState == 1 then (close - avgLow) / avgRange else if lastState == -1 then (close - avgHigh) / avgRange else 0.5 else 0.5; # Plot oscillator plot GannOsc = oscillator; GannOsc.SetLineWeight(2); GannOsc.AssignValueColor( if lastState == 1 then CreateColor(0, 255, 0) # Green else if lastState == -1 then CreateColor(255, 165, 0) # Orange else Color.GRAY ); # Plot midline plot MidLine = 0.5; MidLine.SetDefaultColor(Color.LIGHT_GRAY); MidLine.SetStyle(Curve.SHORT_DASH); # 2 Standard Deviation Full input deviations = 2.0; input deviations2 = 2.5; input fullRange = yes; input length = 300; def regression; def stdDeviation; if (fullRange) { regression = InertiaAll(GannOsc); stdDeviation = StDevAll(GannOsc); } else { regression = InertiaAll(GannOsc, length); stdDeviation = StDevAll(GannOsc, length); } plot UpperLine1 = regression + deviations * stdDeviation; #plot MiddleLine = regression; plot LowerLine1 = regression - deviations * stdDeviation; UpperLine1.SetDefaultColor(Color.RED); LowerLine1.SetDefaultColor(Color.GREEN); UpperLine1.SetLineWeight(1); LowerLine1.SetLineWeight(1); UpperLine1.HideBubble(); UpperLine1.HideTitle(); LowerLine1.HideBubble(); LowerLine1.HideTitle(); plot UpperLine2 = regression + deviations2 * stdDeviation; plot LowerLine2 = regression - deviations2 * stdDeviation; UpperLine2.SetDefaultColor(Color.RED); LowerLine2.SetDefaultColor(Color.GREEN); UpperLine2.SetLineWeight(1); LowerLine2.SetLineWeight(1); UpperLine2.HideBubble(); UpperLine2.HideTitle(); LowerLine2.HideBubble(); LowerLine2.HideTitle(); AddCloud(UpperLine2, UpperLine1, Color.RED, Color.CURRENT); AddCloud(LowerLine1, LowerLine2, Color.GREEN, Color.CURRENT); # === Oscillator Range Analysis === def isOverbought2 = GannOsc >= UpperLine2; def isOverbought1 = GannOsc >= UpperLine1; def isOversold2 = GannOsc <= LowerLine2; def isOversold1 = GannOsc <= LowerLine1; def oscZone = if isOverbought2 then 2 else if isOverbought1 then 1 else if isOversold2 then -2 else if isOversold1 then -1 else 0; def forecastSignal = if upSignal and oscZone <= -1 then 1 # Strong Buy else if downSignal and oscZone >= 1 then -1 # Strong Sell else if upSignal then 2 # Buy Opportunity else if downSignal then -2 # Sell Opportunity else 0; # === AddLabel Displays === AddLabel(yes, if upSignal then "TREND: Bullish (UP)" else if downSignal then "TREND: Bearish (DOWN)" else "TREND: Neutral/Sideways", if upSignal then Color.GREEN else if downSignal then Color.RED else Color.GRAY ); AddLabel(yes, "GANN STATE: " + (if lastState == 1 then "Bull Zone" else if lastState == -1 then "Bear Zone" else "Neutral"), if lastState == 1 then CreateColor(0, 255, 0) else if lastState == -1 then CreateColor(255, 165, 0) else Color.GRAY ); AddLabel(yes, "OSC Range: " + (if oscZone == 2 then "Overbought (2σ)" else if oscZone == 1 then "Overbought (1.5σ)" else if oscZone == -1 then "Oversold (1.5σ)" else if oscZone == -2 then "Oversold (2σ)" else "In Range"), if oscZone >= 1 then Color.RED else if oscZone <= -1 then Color.GREEN else Color.LIGHT_GRAY ); AddLabel(yes, "FORECAST: " + (if forecastSignal == 1 then "Strong BUY Zone" else if forecastSignal == -1 then "Strong SELL Zone" else if forecastSignal == 2 then "Buying Opportunity" else if forecastSignal == -2 then "Selling Opportunity" else "Wait / Watch"), if forecastSignal == 1 or forecastSignal == 2 then Color.GREEN else if forecastSignal == -1 or forecastSignal == -2 then Color.RED else Color.YELLOW );
Here:
Crosses above signal https://tos.mx/!Ri7WMkSuThis script looks great! Good signals when price crosses above or below the line. How do I scan for a cross above (bull) and also below ( bear) the line ?
Crosses below Upper Level 1 https://tos.mx/!u3MstVjq
Crosses above Lower line 1 https://tos.mx/!jqRGmTwz
overall Bullish GHLA https://tos.mx/!qTSZJsFB
Thanks for the quick reply. I got the crosses above signal line to work. But I couldn't get the crosses "below the signal line to work". Says error when I tried to open Shared Item. I assume this indicator does not repaint?Crosses above signal https://tos.mx/!Ri7WMkSu
Crosses below Upper Level 1 https://tos.mx/!u3MstVjq
Crosses above Lower line 1 https://tos.mx/!jqRGmTwz
overall Bullish GHLA https://tos.mx/!qTSZJsFB
I deleted all the shared items. I tried to open the shared script for "below the upper level" but it still said error. Next step? Thanks in advance. My second question was does this indicator "repaint"...the crossing signals look great on a historical basis?
Last edited by a moderator:
I am not having any issues with any of the shared links.I deleted all the shared items. I tried to open the shared script for "below the upper level" but it still said error. Next step? Thanks in advance. My second question was does this indicator "repaint"...the crossing signals look great on a historical basis?
Which specific link is causing you distress?
Which step in the instructions are you getting hung up?
https://usethinkscript.com/threads/how-to-use-shared-chart-links.20899/
I see no obvious repainting code in the study.
But do keep us updated.
this script should NOT repaint historically, but it can change during the active bar, which many traders interpret as repainting. CANDO13579 Original scriptI am not having any issues with any of the shared links.
Which specific link is causing you distress?
Which step in the instructions are you getting hung up?
https://usethinkscript.com/threads/how-to-use-shared-chart-links.20899/
I see no obvious repainting code in the study.
But do keep us updated.
Code:
# GHLA_SuperTrend_CCI_High_Low_Activator_Oscillator
#By CANDO13579

declare lower;
declare real_size;
input ghlaPeriod = 10;
input stPeriod = 14;
input stShiftTicks = 20.0;
input useFilter = yes;

def minTick = TickSize();
def shift = stShiftTicks * minTick;

# -----------------------------
# GHLA Logic
# -----------------------------
def ghlaAvgH = Average(high, ghlaPeriod);
def ghlaAvgL = Average(low, ghlaPeriod);

def sw = if close > ghlaAvgH then 1
         else if close < ghlaAvgL then -1
         else 0;

def ghlaDir = CompoundValue(1, if sw != 0 then sw else ghlaDir[1], 0);
def ghlaLevel = if ghlaDir < 0 then ghlaAvgH else ghlaAvgL;

# -----------------------------
# Custom CCI using Typical Price
# -----------------------------
def tp = (high + low + close) / 3;
def tpSMA = Average(tp, stPeriod);
def meanDev = Average(AbsValue(tp - tpSMA), stPeriod);
def cciValue = if meanDev == 0 then 0 else (tp - tpSMA) / (0.015 * meanDev);

# -----------------------------
# SuperTrend State Machine
# -----------------------------

# stFlag: 1=long, -1=short
rec stFlag = if IsNaN(stFlag[1]) then if cciValue >= 0 then 1 else -1
             else if cciValue > 0 and stFlag[1] <= 0 then 1
             else if cciValue < 0 and stFlag[1] >= 0 then -1
             else stFlag[1];

rec st = if IsNaN(st[1]) then if cciValue >= 0 then low - shift else high + shift
         else
            if cciValue > 0 and stFlag[1] <= 0 then low - shift
            else if cciValue < 0 and stFlag[1] >= 0 then high + shift
            else
                if stFlag > 0 and (low - shift) > st[1] then low - shift
                else if stFlag < 0 and (high + shift) < st[1] then high + shift
                else
                    if useFilter and stFlag > 0 and st[1] < st[1] and (close < open or high < high[1]) then st[1]
                    else if useFilter and stFlag < 0 and st[1] > st[1] and (close > open or low > low[1]) then st[1]
                    else st[1];

# -----------------------------
# signals
# -----------------------------
def notNaST = !IsNaN(st);
def upSignal = notNaST and close > st and close > ghlaLevel;
def downSignal = notNaST and close < st and close < ghlaLevel;
def neutralSignal = notNaST and !upSignal and !downSignal;

# -----------------------------
# Output (centered)
# -----------------------------
def signalCenter = 0;
plot Sig = signalCenter;
Sig.SetPaintingStrategy(PaintingStrategy.HORIZONTAL);
Sig.SetLineWeight(4);

Sig.AssignValueColor(
    if upSignal then Color.GREEN
    else if downSignal then Color.RED
    else Color.LIGHT_GRAY
);

# Boundary reference lines
# -----------------------------
plot UpperLine = 1;
UpperLine.SetDefaultColor(Color.DARK_GRAY);
UpperLine.SetStyle(Curve.SHORT_DASH);

plot LowerLine = -1;
LowerLine.SetDefaultColor(Color.DARK_GRAY);
LowerLine.SetStyle(Curve.SHORT_DASH);

# Gann High/Low Activator Oscillator

input activatorPeriod = 14;

# Calculate simple moving averages
def avgHigh = Average(high, activatorPeriod);
def avgLow = Average(low, activatorPeriod);

# Determine state
def bullState = close > avgHigh;
def bearState = close < avgLow;

# Track the last valid state
def lastState = CompoundValue(1,
    if bullState then 1
    else if bearState then -1
    else lastState[1],
0);

def avgRange = avgHigh - avgLow;
def oscillator =
    if avgRange != 0 then
        if lastState == 1 then (close - avgLow) / avgRange
        else if lastState == -1 then (close - avgHigh) / avgRange
        else 0.5
    else 0.5;

# Plot oscillator
plot GannOsc = oscillator;
GannOsc.SetLineWeight(2);
GannOsc.AssignValueColor(
    if lastState == 1 then CreateColor(0, 255, 0) # Green
    else if lastState == -1 then CreateColor(255, 165, 0) # Orange
    else Color.GRAY
);

# Plot midline
plot MidLine = 0.5;
MidLine.SetDefaultColor(Color.LIGHT_GRAY);
MidLine.SetStyle(Curve.SHORT_DASH);Cando's Oscillator does not repaint either but there is added features to this than the original - Regression + Standard Deviation Bands, now this will change depending on the chart timeframes and visual ranges.
Code:
# GHLA_SuperTrend_CCI_High_Low_Activator_Oscillator
#By CANDO13579

declare lower;
declare real_size;
input ghlaPeriod = 10;
input stPeriod = 14;
input stShiftTicks = 20.0;
input useFilter = yes;

def minTick = TickSize();
def shift = stShiftTicks * minTick;

# -----------------------------
# GHLA Logic
# -----------------------------
def ghlaAvgH = Average(high, ghlaPeriod);
def ghlaAvgL = Average(low, ghlaPeriod);

def sw = if close > ghlaAvgH then 1
         else if close < ghlaAvgL then -1
         else 0;

def ghlaDir = CompoundValue(1, if sw != 0 then sw else ghlaDir[1], 0);
def ghlaLevel = if ghlaDir < 0 then ghlaAvgH else ghlaAvgL;

# -----------------------------
# Custom CCI using Typical Price
# -----------------------------
def tp = (high + low + close) / 3;
def tpSMA = Average(tp, stPeriod);
def meanDev = Average(AbsValue(tp - tpSMA), stPeriod);
def cciValue = if meanDev == 0 then 0 else (tp - tpSMA) / (0.015 * meanDev);

# -----------------------------
# SuperTrend State Machine
# -----------------------------

# stFlag: 1=long, -1=short
rec stFlag = if IsNaN(stFlag[1]) then if cciValue >= 0 then 1 else -1
             else if cciValue > 0 and stFlag[1] <= 0 then 1
             else if cciValue < 0 and stFlag[1] >= 0 then -1
             else stFlag[1];

rec st = if IsNaN(st[1]) then if cciValue >= 0 then low - shift else high + shift
         else
            if cciValue > 0 and stFlag[1] <= 0 then low - shift
            else if cciValue < 0 and stFlag[1] >= 0 then high + shift
            else
                if stFlag > 0 and (low - shift) > st[1] then low - shift
                else if stFlag < 0 and (high + shift) < st[1] then high + shift
                else
                    if useFilter and stFlag > 0 and st[1] < st[1] and (close < open or high < high[1]) then st[1]
                    else if useFilter and stFlag < 0 and st[1] > st[1] and (close > open or low > low[1]) then st[1]
                    else st[1];

# -----------------------------
# signals
# -----------------------------
def notNaST = !IsNaN(st);
def upSignal = notNaST and close > st and close > ghlaLevel;
def downSignal = notNaST and close < st and close < ghlaLevel;
def neutralSignal = notNaST and !upSignal and !downSignal;

# -----------------------------
# Output (centered)
# -----------------------------
def signalCenter = 0;
plot Sig = signalCenter;
Sig.SetPaintingStrategy(PaintingStrategy.HORIZONTAL);
Sig.SetLineWeight(4);

Sig.AssignValueColor(
    if upSignal then Color.GREEN
    else if downSignal then Color.RED
    else Color.LIGHT_GRAY
);

# Boundary reference lines
# -----------------------------
plot UpperLine = 1;
UpperLine.SetDefaultColor(Color.DARK_GRAY);
UpperLine.SetStyle(Curve.SHORT_DASH);

plot LowerLine = -1;
LowerLine.SetDefaultColor(Color.DARK_GRAY);
LowerLine.SetStyle(Curve.SHORT_DASH);

# Gann High/Low Activator Oscillator

input activatorPeriod = 14;

# Calculate simple moving averages
def avgHigh = Average(high, activatorPeriod);
def avgLow = Average(low, activatorPeriod);

# Determine state
def bullState = close > avgHigh;
def bearState = close < avgLow;

# Track the last valid state
def lastState = CompoundValue(1,
    if bullState then 1
    else if bearState then -1
    else lastState[1],
0);

def avgRange = avgHigh - avgLow;
def oscillator =
    if avgRange != 0 then
        if lastState == 1 then (close - avgLow) / avgRange
        else if lastState == -1 then (close - avgHigh) / avgRange
        else 0.5
    else 0.5;

# Plot oscillator
plot GannOsc = oscillator;
GannOsc.SetLineWeight(2);
GannOsc.AssignValueColor(
    if lastState == 1 then CreateColor(0, 255, 0) # Green
    else if lastState == -1 then CreateColor(255, 165, 0) # Orange
    else Color.GRAY
);

# Plot midline
plot MidLine = 0.5;
MidLine.SetDefaultColor(Color.LIGHT_GRAY);
MidLine.SetStyle(Curve.SHORT_DASH);
# 2 Standard Deviation Full
input deviations = 1.5;
input deviations2 = 2.0;
input fullRange = yes;
input length = 300;
def regression;
def stdDeviation;
if (fullRange) {
regression = InertiaAll(GannOsc);
stdDeviation = StDevAll(GannOsc);
} else {
regression = InertiaAll(GannOsc, length);
stdDeviation = StDevAll(GannOsc, length);
}
plot UpperLine1 = regression + deviations * stdDeviation;
#plot MiddleLine = regression;
plot LowerLine1 = regression - deviations * stdDeviation;
UpperLine1.SetDefaultColor(Color.RED);
LowerLine1.SetDefaultColor(Color.GREEN);
UpperLine1.SetLineWeight(1);
LowerLine1.SetLineWeight(1);
UpperLine1.HideBubble();
UpperLine1.HideTitle();
LowerLine1.HideBubble();
LowerLine1.HideTitle();
plot UpperLine2 = regression + deviations2 * stdDeviation;
plot LowerLine2 = regression - deviations2 * stdDeviation;
UpperLine2.SetDefaultColor(Color.RED);
LowerLine2.SetDefaultColor(Color.GREEN);
UpperLine2.SetLineWeight(1);
LowerLine2.SetLineWeight(1);
UpperLine2.HideBubble();
UpperLine2.HideTitle();
LowerLine2.HideBubble();
LowerLine2.HideTitle();
AddCloud(UpperLine2, UpperLine1, Color.RED, Color.CURRENT);
AddCloud(LowerLine1, LowerLine2, Color.GREEN, Color.CURRENT);
# === Oscillator Range Analysis (no redefinitions) ===
def isOverbought2 = GannOsc >= UpperLine2;
def isOverbought1 = GannOsc >= UpperLine1;
def isOversold2 = GannOsc <= LowerLine2;
def isOversold1 = GannOsc <= LowerLine1;
def oscZone =
if isOverbought2 then 2
else if isOverbought1 then 1
else if isOversold2 then -2
else if isOversold1 then -1
else 0;
def forecastSignal =
if upSignal and oscZone <= -1 then 1 # Strong Buy
else if downSignal and oscZone >= 1 then -1 # Strong Sell
else if upSignal then 2 # Buy Opportunity
else if downSignal then -2 # Sell Opportunity
else 0;
# === AddLabel Displays ===
AddLabel(yes,
if upSignal then "TREND: Bullish (UP)"
else if downSignal then "TREND: Bearish (DOWN)"
else "TREND: Neutral/Sideways",
if upSignal then Color.GREEN
else if downSignal then Color.RED
else Color.GRAY
);
AddLabel(yes,
"GANN STATE: " +
(if lastState == 1 then "Bull Zone"
else if lastState == -1 then "Bear Zone"
else "Neutral"),
if lastState == 1 then CreateColor(0, 255, 0)
else if lastState == -1 then CreateColor(255, 165, 0)
else Color.GRAY
);
AddLabel(yes,
"OSC Range: " +
(if oscZone == 2 then "Overbought (2σ)"
else if oscZone == 1 then "Overbought (1.5σ)"
else if oscZone == -1 then "Oversold (1.5σ)"
else if oscZone == -2 then "Oversold (2σ)"
else "In Range"),
if oscZone >= 1 then Color.RED
else if oscZone <= -1 then Color.GREEN
else Color.LIGHT_GRAY
);
AddLabel(yes,
"FORECAST: " +
(if forecastSignal == 1 then "Strong BUY Zone"
else if forecastSignal == -1 then "Strong SELL Zone"
else if forecastSignal == 2 then "Buying Opportunity"
else if forecastSignal == -2 then "Selling Opportunity"
else "Wait / Watch"),
if forecastSignal == 1 or forecastSignal == 2 then Color.GREEN
else if forecastSignal == -1 or forecastSignal == -2 then Color.RED
else Color.YELLOW
);This stripped down version is less memory and computing intensive - this version is actually worth putting on the chart, and it’s much better than the original scripts you showed. (opinion based on how I set up my charts) - I stripped the indicator down to execution signals only.
Code:
# =========================================================
# antwerks – Light Execution Filter
# Extracted from GHLA + SuperTrend + Gann σ zones
# Trend state + pullback timing only
# =========================================================

declare lower;

# -------- Inputs --------
input ghlaPeriod     = 10;
input stPeriod       = 14;
input stShiftTicks   = 20.0;
input activatorPeriod = 14;

input deviations1 = 1.5;
input deviations2 = 2.0;
input fullRange   = yes;
input length      = 300;

# -------- Helpers --------
def minTick = TickSize();
def shift   = stShiftTicks * minTick;

# =========================
# 1) Trend state
# =========================

# GHLA envelope
def ghlaAvgH = Average(high, ghlaPeriod);
def ghlaAvgL = Average(low,  ghlaPeriod);

def sw =
    if close > ghlaAvgH then 1
    else if close < ghlaAvgL then -1
    else 0;

rec ghlaDir = CompoundValue(1, if sw != 0 then sw else ghlaDir[1], 0);
def ghlaLevel = if ghlaDir < 0 then ghlaAvgH else ghlaAvgL;

# CCI SuperTrend state
def tp      = (high + low + close) / 3;
def tpSMA   = Average(tp, stPeriod);
def meanDev = Average(AbsValue(tp - tpSMA), stPeriod);
def cciValue =
    if meanDev == 0 then 0
    else (tp - tpSMA) / (0.015 * meanDev);

# state flag
rec stFlag =
    if IsNaN(stFlag[1]) then if cciValue >= 0 then 1 else -1
    else if cciValue > 0 and stFlag[1] <= 0 then 1
    else if cciValue < 0 and stFlag[1] >= 0 then -1
    else stFlag[1];

# trailing level
rec st =
    if IsNaN(st[1]) then
        if cciValue >= 0 then low - shift else high + shift
    else
        if cciValue > 0 and stFlag[1] <= 0 then low - shift
        else if cciValue < 0 and stFlag[1] >= 0 then high + shift
        else
            if stFlag > 0 and (low  - shift) > st[1] then low  - shift
            else if stFlag < 0 and (high + shift) < st[1] then high + shift
            else st[1];

def upTrend   = close > st and close > ghlaLevel;
def downTrend = close < st and close < ghlaLevel;

# =========================
# 2) Stretch / pullback zone
# =========================

# Gann high/low oscillator
def avgHigh = Average(high, activatorPeriod);
def avgLow  = Average(low,  activatorPeriod);

def bullState = close > avgHigh;
def bearState = close < avgLow;

rec lastState =
    CompoundValue(1,
        if bullState then 1
        else if bearState then -1
        else lastState[1], 0);

def avgRange = avgHigh - avgLow;

def GannOsc =
    if avgRange != 0 then
        if lastState == 1 then (close - avgLow)  / avgRange
        else if lastState == -1 then (close - avgHigh) / avgRange
        else 0.5
    else 0.5;

# σ bands on oscillator
def regression;
def stdDev;

if fullRange {
    regression = InertiaAll(GannOsc);
    stdDev     = StDevAll(GannOsc);
} else {
    regression = InertiaAll(GannOsc, length);
    stdDev     = StDevAll(GannOsc, length);
}

def upper1 = regression + deviations1 * stdDev;
def lower1 = regression - deviations1 * stdDev;
def upper2 = regression + deviations2 * stdDev;
def lower2 = regression - deviations2 * stdDev;

# stretch zones
def pullbackLong  = GannOsc <= lower1;   # -1σ or deeper
def pullbackShort = GannOsc >= upper1;   # +1σ or deeper

# =========================
# Final execution permissions
# =========================

# These are the only two outputs you should use
plot ExecLongOK  = upTrend   and pullbackLong;
plot ExecShortOK = downTrend and pullbackShort;

ExecLongOK.SetPaintingStrategy(PaintingStrategy.BOOLEAN_ARROW_UP);
ExecLongOK.SetDefaultColor(Color.CYAN);
ExecLongOK.SetLineWeight(2);

ExecShortOK.SetPaintingStrategy(PaintingStrategy.BOOLEAN_ARROW_DOWN);
ExecShortOK.SetDefaultColor(Color.MAGENTA);
ExecShortOK.SetLineWeight(2);

# Optional tiny state line
plot TrendState =
    if upTrend then 1
    else if downTrend then -1
    else 0;

TrendState.SetPaintingStrategy(PaintingStrategy.HISTOGRAM);
TrendState.AssignValueColor(
    if TrendState > 0 then Color.GREEN
    else if TrendState < 0 then Color.RED
    else Color.GRAY
);

AddLabel(yes,
    if upTrend then "EXEC TREND: UP"
    else if downTrend then "EXEC TREND: DOWN"
    else "EXEC TREND: NEUTRAL",
    if upTrend then Color.GREEN
    else if downTrend then Color.RED
    else Color.GRAY
);
plot midline = 0;This is the script that keeps saying error.....https://tos.mx/!u3MstVjqI am not having any issues with any of the shared links.
Which specific link is causing you distress?
Which step in the instructions are you getting hung up?
https://usethinkscript.com/threads/how-to-use-shared-chart-links.20899/
I see no obvious repainting code in the study.
But do keep us updated.
Nice job again! You are amazing at scripts!This stripped down version is less memory and computing intensive - this version is actually worth putting on the chart, and it’s much better than the original scripts you showed. (opinion based on how I set up my charts) - I stripped the indicator down to execution signals only.
Code:# ========================================================= # antwerks – Light Execution Filter # Extracted from GHLA + SuperTrend + Gann σ zones # Trend state + pullback timing only # ========================================================= declare lower; # -------- Inputs -------- input ghlaPeriod = 10; input stPeriod = 14; input stShiftTicks = 20.0; input activatorPeriod = 14; input deviations1 = 1.5; input deviations2 = 2.0; input fullRange = yes; input length = 300; # -------- Helpers -------- def minTick = TickSize(); def shift = stShiftTicks * minTick; # ========================= # 1) Trend state # ========================= # GHLA envelope def ghlaAvgH = Average(high, ghlaPeriod); def ghlaAvgL = Average(low, ghlaPeriod); def sw = if close > ghlaAvgH then 1 else if close < ghlaAvgL then -1 else 0; rec ghlaDir = CompoundValue(1, if sw != 0 then sw else ghlaDir[1], 0); def ghlaLevel = if ghlaDir < 0 then ghlaAvgH else ghlaAvgL; # CCI SuperTrend state def tp = (high + low + close) / 3; def tpSMA = Average(tp, stPeriod); def meanDev = Average(AbsValue(tp - tpSMA), stPeriod); def cciValue = if meanDev == 0 then 0 else (tp - tpSMA) / (0.015 * meanDev); # state flag rec stFlag = if IsNaN(stFlag[1]) then if cciValue >= 0 then 1 else -1 else if cciValue > 0 and stFlag[1] <= 0 then 1 else if cciValue < 0 and stFlag[1] >= 0 then -1 else stFlag[1]; # trailing level rec st = if IsNaN(st[1]) then if cciValue >= 0 then low - shift else high + shift else if cciValue > 0 and stFlag[1] <= 0 then low - shift else if cciValue < 0 and stFlag[1] >= 0 then high + shift else if stFlag > 0 and (low - shift) > st[1] then low - shift else if stFlag < 0 and (high + shift) < st[1] then high + shift else st[1]; def upTrend = close > st and close > ghlaLevel; def downTrend = close < st and close < ghlaLevel; # ========================= # 2) Stretch / pullback zone # ========================= # Gann high/low oscillator def avgHigh = Average(high, activatorPeriod); def avgLow = Average(low, activatorPeriod); def bullState = close > avgHigh; def bearState = close < avgLow; rec lastState = CompoundValue(1, if bullState then 1 else if bearState then -1 else lastState[1], 0); def avgRange = avgHigh - avgLow; def GannOsc = if avgRange != 0 then if lastState == 1 then (close - avgLow) / avgRange else if lastState == -1 then (close - avgHigh) / avgRange else 0.5 else 0.5; # σ bands on oscillator def regression; def stdDev; if fullRange { regression = InertiaAll(GannOsc); stdDev = StDevAll(GannOsc); } else { regression = InertiaAll(GannOsc, length); stdDev = StDevAll(GannOsc, length); } def upper1 = regression + deviations1 * stdDev; def lower1 = regression - deviations1 * stdDev; def upper2 = regression + deviations2 * stdDev; def lower2 = regression - deviations2 * stdDev; # stretch zones def pullbackLong = GannOsc <= lower1; # -1σ or deeper def pullbackShort = GannOsc >= upper1; # +1σ or deeper # ========================= # Final execution permissions # ========================= # These are the only two outputs you should use plot ExecLongOK = upTrend and pullbackLong; plot ExecShortOK = downTrend and pullbackShort; ExecLongOK.SetPaintingStrategy(PaintingStrategy.BOOLEAN_ARROW_UP); ExecLongOK.SetDefaultColor(Color.CYAN); ExecLongOK.SetLineWeight(2); ExecShortOK.SetPaintingStrategy(PaintingStrategy.BOOLEAN_ARROW_DOWN); ExecShortOK.SetDefaultColor(Color.MAGENTA); ExecShortOK.SetLineWeight(2); # Optional tiny state line plot TrendState = if upTrend then 1 else if downTrend then -1 else 0; TrendState.SetPaintingStrategy(PaintingStrategy.HISTOGRAM); TrendState.AssignValueColor( if TrendState > 0 then Color.GREEN else if TrendState < 0 then Color.RED else Color.GRAY ); AddLabel(yes, if upTrend then "EXEC TREND: UP" else if downTrend then "EXEC TREND: DOWN" else "EXEC TREND: NEUTRAL", if upTrend then Color.GREEN else if downTrend then Color.RED else Color.GRAY ); plot midline = 0;
I just loaded it and ran the scan here are the results - make sure you are not in the "ONDEMAND" pages or papertradingThis is the script that keeps saying error.....https://tos.mx/!u3MstVjq
Join useThinkScript to post your question to a community of 21,000+ developers and traders.
| Thread starter | Similar threads | Forum | Replies | Date |
|---|---|---|---|---|
| C | Supertrend -- The AGAIG Version For ThinkOrSwim | Custom | 0 | |
|
|
Perfect SuperTrend For ThinkOrSwim | Custom | 8 | |
| B | Semaphore Supertrend For ThinkOrSwim | Custom | 0 | |
|
|
PDF-MA Supertrend [BackQuant] for ThinkOrSwim | Custom | 18 | |
|
|
SuperTrend Volume [BigBeluga] for ThinkOrSwim | Custom | 12 |
Similar threads
Not the exact question you're looking for?
Start a new thread and receive assistance from our community.
87k+
Posts
706
Online
Similar threads
Similar threads
The Market Trading Game Changer
Join 2,500+ subscribers inside the useThinkScript VIP Membership Club
- Exclusive indicators
- Proven strategies & setups
- Private Discord community
- ‘Buy The Dip’ signal alerts
- Exclusive members-only content
- Add-ons and resources
- 1 full year of unlimited support
Frequently Asked Questions
What is useThinkScript?
useThinkScript is the #1 community of stock market investors using indicators and other tools to power their trading strategies. Traders of all skill levels use our forums to learn about scripting and indicators, help each other, and discover new ways to gain an edge in the markets.
How do I get started?
We get it. Our forum can be intimidating, if not overwhelming. With thousands of topics, tens of thousands of posts, our community has created an incredibly deep knowledge base for stock traders. No one can ever exhaust every resource provided on our site.
If you are new, or just looking for guidance, here are some helpful links to get you started.
- The most viewed thread:
https://usethinkscript.com/threads/repainting-trend-reversal-for-thinkorswim.183/ - Our most popular indicator:
https://usethinkscript.com/threads/buy-the-dip-indicator-for-thinkorswim.3553/ - Answers to frequently asked questions:
https://usethinkscript.com/threads/answers-to-commonly-asked-questions.6006/
What are the benefits of VIP Membership?
VIP members get exclusive access to these proven and tested premium indicators: Buy the Dip, Advanced Market Moves 2.0, Take Profit, and Volatility Trading Range. In addition, VIP members get access to over 50 VIP-only custom indicators, add-ons, and strategies, private VIP-only forums, private Discord channel to discuss trades and strategies in real-time, customer support, trade alerts, and much more. Learn all about VIP membership here.
How can I access the premium indicators?
To access the premium indicators, which are plug and play ready, sign up for VIP membership here.