Getting Data From An Illiquid Asset

StoneMan

Member
Plus
I'm working with options data which can be quite illiquid. On certain instruments you may get only a few ticks per day or even zero. Because of this bars based look back strategy will not work due to the chart being incomplete.

My workaround to this is using the time of day to get the data at the right time. I'm reaching out because I am not sure if thinkscript is capable of returning a bar based on the time.

The logic looks something like this:

If data is present in the time slot 1 on the current session get data, if not set relevant values to zero.

If data is present in the time slot 2 ob the current sesaion get data, if not set relevant values to zero.

.
.
.

I also want to know what time slot is currently active in a given session. The trade day is from 930 am to 4pm. That is 13 30 minute sessions over 6.5 hours. This is how I am planning on discritizing the trading day. I need a variable that can return 1-13 corresponding with the proper time slot. That way averages can be calculated no matter when you run the code. After the market closes that value would return 13.

Any insight would be greatly appreciated!
 
Solution
As I play around with calcuting theoretical options price something I have noticed is that from time to time the theoretical price is way off the price the option is actually transacting at. Because we know the theoretical price and the real price I believe we have the opportunity to implement some error correcting to hammer down those outliers.

This is my theory for a very rough and dirty way to implement some error correcting of theoretical options calculations based on the real data we have:

-We definitively "know" all the inputs that go into calcuting theoretical option price. Two of them are weak however and they are:

1.)The use of implied volitility of the underlying. This is a generalization across all options and could be...
Hi, @StoneMan @Joshua, I am fascinated with this thread. However I am not on your level of coding and implementing the scripts presented. I was able to follow the instructions to develop the column for WhaleScore on the options chain page and as a column in a watchlist. Question 1: How does the second script presented by @Joshua combine with the first script presented by @StoneMan? Question 2: How do I use the WhaleScore as a Scan filter. I am scanning for UOA and today there are 7 results with .TFC230519C34's showing a 4800+ WhaleScore but that scan is not using WhaleScore as a filter. I've read and re-read this thread multiple times and am just missing something. Clarification would be much appreciated.
 
Last edited:
I am taking another look at trying to debug the posted scripts. The WhaleScore column is the original code from the top of the post being run on a daily time frame. Whale Metrics 2 is the final iteration of the code @Joshua gave me, WhaleMetrics3 is the code that compares the largest dollar spend of the option to the underlying, and WhaleMetrics4 is the code uses the volume to tick ratio to determine block or sweep then displays the high volume and time. These three columns are all being run on a 5 min time frame.

The main problem I am having is that WhaleMetrics3 displays 0% for many of the items displayed even while WhaleMetrics4 seems to be picking up and designating all activity properly. The key difference here is that WhaleMetrics3 calls on the underlying, I think this may be the root of the problem, but I am not sure. Attached below is a picture of my output.
Khwz1qw.png


Here is the code for all custom columns I am running so that it is in one place:

WhaleScore
Code:
#Defining variables

def Delta = Delta();

def Ivol = imp_volatility(GetUnderlyingSymbol());

def OptionMarkPrice = close;

def UnderlyingPrice = close(getUnderlyingSymbol());

def UnderlyingVolume = volume(getUnderlyingSymbol());

#V.A.L.R - Volitility Adjusted Leverage Ratio

def Leverage = (Delta * UnderlyingPrice);

def LeverageRatio = Leverage / OptionMarkPrice;

def VALR = LeverageRatio * Ivol;

#Volume to open interest ratio (if statement pervents divide by by zero errors)

def OpenInterest = if open_interest(period = AggregationPeriod.DAY) == 0 then 1 else open_interest(period = AggregationPeriod.DAY);

def volOI = volume / OpenInterest;  #going to change from day to make scan friendly

#Option dollar volume traded
def DvolumeOpt = volume * ohlc4 * 100;

#Underlying dollar volume traded
def DvolumeUnd = UnderlyingPrice * UnderlyingVolume;

def DvolumeRatio = DvolumeOpt / DvolumeUnd;

#Multiply by 1000 so output better displays in the columns

def WhaleScore = VALR * volOI * DvolumeRatio * 1000;

plot WhalePlot = WhaleScore;

Whale Metrics2
Code:
def TickCount;
def VolRatio;
    if GetDay() == GetLastDay() {
        TickCount = Tick_Count;
        VolRatio = Volume / Tick_Count;
    } else {
        TickCount = 0;
        VolRatio = 0;       
    }
;
def HighTick;
def TickTime;
def TickHour;
def TickMinute;
    if TickCount > HighTick[1] {
        HighTick = TickCount;
        TickTime = secondsfromTime(0000);
        TickHour = Floor(TickTime / 60 / 60);
        TickMinute = Floor((TickTime / 60 / 60 - TickHour) * 60);
    } else {
        HighTick = HighTick[1];
        TickTime = TickTime[1];
        TickHour = TickHour[1];
        TickMinute = TickMinute[1];
    }
;
def HighVol;
def VolTime;
def VolHour;
def VolMinute;
def V; def T;
    if VolRatio > HighVol[1] {
        HighVol = VolRatio;
        VolTime = secondsfromTime(0000);
        VolHour = Floor(VolTime / 60 / 60);
        VolMinute = Floor((VolTime / 60 / 60 - VolHour) * 60);
        v = Volume;
        t = Tick_Count;
    } else {
        HighVol = HighVol[1];
        VolTime = VolTime[1];
        VolHour = VolHour[1];
        VolMinute = VolMinute[1];
        v = V[1];
        t = T[1];
    }
;
addLabel(Yes,
    " "
    + asPrice(TickHour)
    + ":" + asPrice(TickMinute)
    + " (" + asPrice(HighTick) + ") - "
    + asPrice(VolHour)
    + ":" + asPrice(VolMinute)
    + " (" + asPrice(Round(HighVol,2)) + ") - "
    + asprice(V) + " / " + asPrice(t)
    + " "
);

WhaleMetrics3
Code:
def optionsPrice = close * 100;

def TickCount;
def VolRatio;
if GetDay() == GetLastDay() {
    TickCount = Tick_Count;
    VolRatio = Volume / Tick_Count;
} else {
    TickCount = 0;
    VolRatio = 0;       
}

def HighTick;
def TickTime;
def TickHour;
def TickMinute;
if TickCount > HighTick[1] {
    HighTick = TickCount;
    TickTime = secondsfromTime(0000);
    TickHour = Floor(TickTime / 60 / 60);
    TickMinute = Floor((TickTime / 60 / 60 - TickHour) * 60);
} else {
    HighTick = HighTick[1];
    TickTime = TickTime[1];
    TickHour = TickHour[1];
    TickMinute = TickMinute[1];
}

def HighVol;
def VolTime;
def VolHour;
def VolMinute;
def V; def T;
if VolRatio > HighVol[1] {
    HighVol = VolRatio;
    VolTime = secondsfromTime(0000);
    VolHour = Floor(VolTime / 60 / 60);
    VolMinute = Floor((VolTime / 60 / 60 - VolHour) * 60);
    v = Volume;
    t = Tick_Count;
} else {
    HighVol = HighVol[1];
    VolTime = VolTime[1];
    VolHour = VolHour[1];
    VolMinute = VolMinute[1];
    v = V[1];
    t = T[1];
}

def BlockVolume = v;
def SweepVolume = TickCount * t;
def BlockVolumeTicRatio = BlockVolume / t;

def underlyingPrice = close(GetUnderlyingSymbol());
def underlyingVolume = volume(GetUnderlyingSymbol());

def isBlockPeriod = VolRatio >= 50;
def isSweepPeriod = TickCount > HighTick[1];

def BlockUnderlyingVolume = if isBlockPeriod then underlyingVolume else 0;
def SweepUnderlyingVolume = if isSweepPeriod then underlyingVolume else 0;

def BlockOptionsMoneySpent = BlockVolume * optionsPrice;
def SweepOptionsMoneySpent = SweepVolume * optionsPrice;
def BlockUnderlyingMoneySpent = BlockUnderlyingVolume * underlyingPrice;
def SweepUnderlyingMoneySpent = SweepUnderlyingVolume * underlyingPrice;

def BlockOptionsToUnderlyingRatio = if BlockUnderlyingMoneySpent != 0 then (BlockOptionsMoneySpent / BlockUnderlyingMoneySpent) * 100 else 0;
def SweepOptionsToUnderlyingRatio = if SweepUnderlyingMoneySpent != 0 then (SweepOptionsMoneySpent / SweepUnderlyingMoneySpent) * 100 else 0;

addLabel(yes,
    if (BlockOptionsMoneySpent > SweepOptionsMoneySpent and isBlockPeriod) then
        asPrice(BlockOptionsToUnderlyingRatio) + "% B " + asPrice(VolHour) + ":" + asPrice(VolMinute)
    else if (BlockOptionsMoneySpent > SweepOptionsMoneySpent and !isBlockPeriod) then
        asPrice(BlockOptionsToUnderlyingRatio) + "% S " + asPrice(VolHour) + ":" + asPrice(VolMinute)
    else if (BlockOptionsMoneySpent < SweepOptionsMoneySpent) then
        asPrice(SweepOptionsToUnderlyingRatio) + "% S " + asPrice(TickHour) + ":" + asPrice(TickMinute)
    else if (BlockOptionsMoneySpent == SweepOptionsMoneySpent) then
        if (isBlockPeriod) then
            asPrice(BlockOptionsToUnderlyingRatio) + "% B " + asPrice(VolHour) + ":" + asPrice(VolMinute)
        else
            asPrice(SweepOptionsToUnderlyingRatio) + "% S " + asPrice(TickHour) + ":" + asPrice(TickMinute)
    else
        ""
);

WhaleMetrics4
Code:
def TickCount;
def VolRatio;
if GetDay() == GetLastDay() {
    TickCount = Tick_Count;
    VolRatio = Volume / Tick_Count;
} else {
    TickCount = 0;
    VolRatio = 0;       
}
;
def HighTick;
def TickTime;
def TickHour;
def TickMinute;
if TickCount > HighTick[1] {
    HighTick = TickCount;
    TickTime = secondsfromTime(0000);
    TickHour = Floor(TickTime / 60 / 60);
    TickMinute = Floor((TickTime / 60 / 60 - TickHour) * 60);
} else {
    HighTick = HighTick[1];
    TickTime = TickTime[1];
    TickHour = TickHour[1];
    TickMinute = TickMinute[1];
}
;
def HighVol;
def VolTime;
def VolHour;
def VolMinute;
def V; def T;
if VolRatio > HighVol[1] {
    HighVol = VolRatio;
    VolTime = secondsfromTime(0000);
    VolHour = Floor(VolTime / 60 / 60);
    VolMinute = Floor((VolTime / 60 / 60 - VolHour) * 60);
    v = Volume;
    t = Tick_Count;
} else {
    HighVol = HighVol[1];
    VolTime = VolTime[1];
    VolHour = VolHour[1];
    VolMinute = VolMinute[1];
    v = V[1];
    t = T[1];
}
;
def BlockVolume = v;
def SweepVolume = TickCount * t;
def BlockVolumeTicRatio = BlockVolume / t;

addLabel(yes,
    if (BlockVolume == SweepVolume and BlockVolumeTicRatio >= 50) then
        BlockVolume + " B " + asPrice(VolHour) + ":" + asPrice(VolMinute)
    else if (BlockVolume == SweepVolume and BlockVolumeTicRatio < 50) then
        SweepVolume + " S " + asPrice(TickHour) + ":" + asPrice(TickMinute)
    else if (BlockVolume > SweepVolume) then
        BlockVolume + " B " + asPrice(VolHour) + ":" + asPrice(VolMinute)
    else if (BlockVolume < SweepVolume) then
        SweepVolume + " S " + asPrice(TickHour) + ":" + asPrice(TickMinute)
    else
        ""
);
 
I am taking another look at trying to debug the posted scripts. The WhaleScore column is the original code from the top of the post being run on a daily time frame. Whale Metrics 2 is the final iteration of the code @Joshua gave me, WhaleMetrics3 is the code that compares the largest dollar spend of the option to the underlying, and WhaleMetrics4 is the code uses the volume to tick ratio to determine block or sweep then displays the high volume and time. These three columns are all being run on a 5 min time frame.

The main problem I am having is that WhaleMetrics3 displays 0% for many of the items displayed even while WhaleMetrics4 seems to be picking up and designating all activity properly. The key difference here is that WhaleMetrics3 calls on the underlying, I think this may be the root of the problem, but I am not sure. Attached below is a picture of my output.
What is the rest of your scan query parameters?
 
Just wanted to show off the potential of the WhaleMetrics3 logic when it works for detecting unusual activity. I sorted the results of the scan from high to low then examined the time and sales. Someone smashed the ask for 1850 may 19 puts at 12:38 (you can see in TAS), the column, however, says 13:35, at that time 667 were traded at the same price. An explanation for this would be much smaller volume on the underlying was traded during that 5 minute interval (the aggregation the column is set to). I see now that adding the option volume traded to this output would help make this clearer.

I wanted to share this to show the potential of these signals when they can be made to work properly. SBLK reports earnings May 16th. The scan I am using is the one I shared. Just cross referencing all optionable with reports earnings in 5 days is a great utility.

gJszrK3.png

URZCvMH.png

bBd9tZb.png
 
I just realized that def options price (the first line of code) isn't synced to the high volume or high tick count periods! We would need to grab two different options prices that sync up with those periods in order for this to work. That's probably what's throwing off the internal logic that is comparing prices and setting them to zero when it is trying to determine isBlockPeriod and isSweepPeriod. Hopefully making this change will fix this. Will need to go back and thoroughly check that all variables probably sync up with the block and sweep periods that the first half of the code identifies. Seeing now that I did not do this.
 
I refactored Whale Metrics2 into WhaleMetrics5 so that their outputs would be the same. Attached is a screen shot showing that the outputs match. I set up the structure so that it is ready to include to the extra variables necessary to achieve the desired output from WhaleMetrics3. I also made the variable names easier to follow and added comments to describe the process the code is following.

This is all for tonight, will hopefully get to the correct implementation of WhaleMetrics3 tomorrow. I wanted to set the code up in such a way so that it would be easy to follow and add more to later. May be able to do some fun stuff with changes in implied volatility with this code as the base in the future. Thinking of Options IVol spikes correlating with these kind of volume flows. The bigger the IVol change the more unusual the activity! Intraday values for any of the fundamental functions as ThinkScript lists them (excluding bid and ask) should be able to be worked with here.
nnsTMBL.png


WhaleMetrics5
Code:
#Define base variables from fundamental functions

def TickCount;
def Vol;
def VolRatio;
def OptionPrice;
def UnderlyingVolume;
def UnderlyingPrice;

    if GetDay() == GetLastDay() {
        TickCount = Tick_Count;
        Vol = Volume;
        VolRatio = Volume / Tick_Count;
        OptionPrice = ohlc4 * 100;
        UnderlyingVolume = Volume(GetUnderlyingSymbol());
        UnderlyingPrice = Close(GetUnderlyingSymbol());
    } else {
        TickCount = 0;
        Vol = 0;
        VolRatio = 0;
        OptionPrice = 0;
        UnderlyingVolume = 0;
        UnderlyingPrice = 0;     
    }
;

#Isolate base values at high tick time for sweep detection

#Defining the regime we are isolating
def HighTick;
#Getting the time for that regime
def TickTime;
def TickHour;
def TickMinute;
#Getting extra data for that regime
def HighTickVolume;
#Calculations
    if TickCount > HighTick[1] {
        HighTick = TickCount;
        TickTime = secondsfromTime(0000);
        TickHour = Floor(TickTime / 60 / 60);
        TickMinute = Floor((TickTime / 60 / 60 - TickHour) * 60);
        
        HighTickVolume = Vol;
    } else {
        HighTick = HighTick[1];
        TickTime = TickTime[1];
        TickHour = TickHour[1];
        TickMinute = TickMinute[1];
        
        HighTickVolume = HighTickVolume[1];
    }
;

#Isolate base values at high volume to tick ratio time for block detection

#Defining the regime we are isolating
def HighVolRatio;
#Getting the time for that regime
def VolTime;
def VolHour;
def VolMinute;
#Getting extra data for that regime
def HighVolRatioVolume;
def HighVolRatioTickCount;
#Calculations
    if VolRatio > HighVolRatio[1] {
        HighVolRatio = VolRatio;
        VolTime = secondsfromTime(0000);
        VolHour = Floor(VolTime / 60 / 60);
        VolMinute = Floor((VolTime / 60 / 60 - VolHour) * 60);
        
        HighVolRatioVolume = Vol;
        HighVolRatioTickCount = TickCount;
    } else {
        HighVolRatio = HighVolRatio[1];
        VolTime = VolTime[1];
        VolHour = VolHour[1];
        VolMinute = VolMinute[1];
        
        HighVolRatioVolume = HighVolRatioVolume[1];
        HighVolRatioTickCount = HighVolRatioTickCount[1];
    }
;

#addLabel logic that compares values between high tick and high volume/tick ratio tiems

addLabel(Yes,
    " "
    + asPrice(TickHour)
    + ":" + asPrice(TickMinute)
    + " (" + asPrice(HighTick) + ") - "
    + asPrice(VolHour)
    + ":" + asPrice(VolMinute)
    + " (" + asPrice(Round(HighVolRatio,2)) + ") - "
    + asprice(HighVolRatioVolume) + " / " + asPrice(HighVolRatioTickCount)
    + " "
);
 
I just confirmed that the OptionPrice function works in these columns. The theoretical price is the far-right output of the WhaleMetrics5 column. Instead of feeding it the Ivol of the underlying we can isolate the Ivol of the of the actual option at the time of the unusual activity to get a more accurate measure of its theoretical price. From there we can use the example of calculating theoretical delta given to us by the documentation to get a good estimate of delta at our time of interest. This is huge because it (in theory) solves the problem of not being able to freely grab delta at any time, as the options greeks are not data TD keeps on hand for us like the fundamental functions.

From here we can loop back to the methods used in the original WhaleScore algorithm which relies on delta in the capacity TD gives to us, that being a live feed we cannot manipulate in anyway. The delta data the original whalescore algorithm uses is usually very out of date and a serious hindrance to its effectiveness.

With good delta data (I hope) we can now get an actual eye into the dealer hedging landscape at the time or understand just how many shares worth of leverage was truly exchanged.

I will work on these additions after the ones I previously mentioned. As these columns balloon in complexity my worry is that they have trouble loading. We will see.

https://tlc.thinkorswim.com/center/reference/thinkScript/Functions/Option-Related/Delta

m9yidQx.png
 
I have successfully completed development of the WhaleMetric that compares the options dollar spend to underlying spend for block and sweep periods and displays the ratio of the period with the highest option dollar spend.

Next I will attempt to use the options Ivol and price at these periods to generate an estimated delta greek at the periods of interest so leverage can be factored into the assessment via VALR ratio (see original whalescore post for that definition).

This is a fun one as is though. Very useful tool here imo.
1m3lTrO.png


Code:
#Define base variables from fundamental functions

def TickCount;
def Vol;
def VolRatio;
def OptionPrice;
def UnderlyingVolume;
def UnderlyingPrice;

    if GetDay() == GetLastDay() {
        TickCount = Tick_Count;
        Vol = Volume;
        VolRatio = Volume / Tick_Count;
        OptionPrice = ohlc4 * 100;
        UnderlyingVolume = Volume(GetUnderlyingSymbol());
        UnderlyingPrice = Close(GetUnderlyingSymbol());
    } else {
        TickCount = 0;
        Vol = 0;
        VolRatio = 0;
        OptionPrice = 0;
        UnderlyingVolume = 0;
        UnderlyingPrice = 0;     
    }
;

#Isolate base values at high tick time for sweep detection

#Defining the regime we are isolating
def HighTick;
#Getting the time for that regime
def TickTime;
def TickHour;
def TickMinute;
#Getting extra data for that regime
def HighTickVolume;
def HighTickOptionPrice;
def HighTickUnderlyingVolume;
def HighTickUnderlyingPrice;
#Calculations
    if TickCount > HighTick[1] {
        HighTick = TickCount;

        TickTime = secondsfromTime(0000);
        TickHour = Floor(TickTime / 60 / 60);
        TickMinute = Floor((TickTime / 60 / 60 - TickHour) * 60);
        
        HighTickVolume = Vol;
        HighTickOptionPrice = OptionPrice;
        HighTickUnderlyingVolume = UnderlyingVolume;
        HighTickUnderlyingPrice = UnderlyingPrice;
    } else {
        HighTick = HighTick[1];

        TickTime = TickTime[1];
        TickHour = TickHour[1];
        TickMinute = TickMinute[1];
        
        HighTickVolume = HighTickVolume[1];
        HighTickOptionPrice = HighTickOptionPrice[1];
        HighTickUnderlyingVolume = HighTickUnderlyingVolume[1];
        HighTickUnderlyingPrice = HighTickUnderlyingPrice[1];
    }
;

#Isolate base values at high volume to tick ratio time for block detection

#Defining the regime we are isolating
def HighVolRatio;
#Getting the time for that regime
def VolTime;
def VolHour;
def VolMinute;
#Getting extra data for that regime
def HighVolRatioVolume;
def HighVolRatioTickCount;
def HighVolRatioOptionPrice;
def HighVolRatioUnderlyingVolume;
def HighVolRatioUnderlyingPrice;
#Calculations
    if VolRatio > HighVolRatio[1] {
        HighVolRatio = VolRatio;

        VolTime = secondsfromTime(0000);
        VolHour = Floor(VolTime / 60 / 60);
        VolMinute = Floor((VolTime / 60 / 60 - VolHour) * 60);
        
        HighVolRatioVolume = Vol;
        HighVolRatioTickCount = TickCount;
        HighVolRatioOptionPrice = OptionPrice;
        HighVolRatioUnderlyingVolume = UnderlyingVolume;
        HighVolRatioUnderlyingPrice = UnderlyingPrice;
    } else {
        HighVolRatio = HighVolRatio[1];

        VolTime = VolTime[1];
        VolHour = VolHour[1];
        VolMinute = VolMinute[1];
        
        HighVolRatioVolume = HighVolRatioVolume[1];
        HighVolRatioTickCount = HighVolRatioTickCount[1];
        HighVolRatioOptionPrice = HighVolRatioOptionPrice[1];
        HighVolRatioUnderlyingVolume = HighVolRatioUnderlyingVolume[1];
        HighVolRatioUnderlyingPrice = HighVolRatioUnderlyingPrice[1];
    }
;

#Logic that identifies the dollar spend at the high tick and high volume/tick ratio times

#50 is the arbitrary volume to tick ratio chosen to differentiate between block and sweep
def BlockSweepCutOff = 50;

#Getting option dollar spend to underlying dollar spend ratio for high tick regime (likley sweeps)
def HighTickUnderlyingDollars = HighTickUnderlyingVolume * HighTickUnderlyingPrice;
def HighTickOptionDollars = HighTickVolume * HighTickOptionPrice;
def HighTickOptionUnderlyingDollarRatio = HighTickOptionDollars / HighTickUnderlyingDollars;

#Getting option dollar spend to underlying dollar spend ratio for high volume/tick ratio regime (likley blocks)
def HighVolRatioUnderlyingDollars = HighVolRatioUnderlyingVolume * HighVolRatioUnderlyingPrice;
def HighVolRatioOptionDollars = HighVolRatioVolume * HighVolRatioOptionPrice;
def HighVolRatioOptionUnderlyingDollarRatio = HighVolRatioOptionDollars / HighVolRatioUnderlyingDollars;


#addLabel logic that compares values between high tick and high volume/tick ratio times

addLabel(yes,
    if (HighVolRatioOptionDollars > HighTickOptionDollars and HighVolRatio >= BlockSweepCutOff) then
        asPrice(HighVolRatioOptionUnderlyingDollarRatio * 100) + "% B " + asPrice(VolHour) + ":" + asPrice(VolMinute)
    else if (HighVolRatioOptionDollars > HighTickOptionDollars and  HighVolRatio < BlockSweepCutOff) then
        asPrice(HighVolRatioOptionUnderlyingDollarRatio * 100) + "% S " + asPrice(VolHour) + ":" + asPrice(VolMinute)
    else if (HighVolRatioOptionDollars < HighTickOptionDollars) then
        asPrice(HighTickOptionUnderlyingDollarRatio * 100) + "% S " + asPrice(TickHour) + ":" + asPrice(TickMinute)
    else if (HighVolRatioOptionDollars == HighTickOptionDollars and HighVolRatio >= BlockSweepCutOff) then
         asPrice(HighVolRatioOptionUnderlyingDollarRatio * 100) + "% B " + asPrice(VolHour) + ":" + asPrice(VolMinute)
    else if (HighVolRatioOptionDollars == HighTickOptionDollars and HighVolRatio < BlockSweepCutOff) then
         asPrice(HighTickOptionUnderlyingDollarRatio * 100) + "% S " + asPrice(TickHour) + ":" + asPrice(TickMinute)
    else
        ""
);
 
I have a question about the display output. For the purposes of sorting from high to low AddLabel just goes off of the first digit of the percentage. In order to get that percentage viewed as a full value I would need to display it using AddPlot. My question is can a plot and an AddLabel be used simultaneously in a custom quote? And if so what would be the best way to do that?
 
I have a question about the display output. For the purposes of sorting from high to low AddLabel just goes off of the first digit of the percentage. In order to get that percentage viewed as a full value I would need to display it using AddPlot. My question is can a plot and an AddLabel be used simultaneously in a custom quote? And if so what would be the best way to do that?

column outputs,
pick a function to match the data.
if the data is just numbers , then use plot.
if letters and symbols are desired, then use addlabel.

example of adding extra characters to data in an addlabel, in a column, in order to have it sort correctly.
https://usethinkscript.com/threads/...tion-from-addlabel-function.10456/#post-92584
 
So you have the option to view the output as a signed double with plot OR as a string with addLabel?

I just want to confirm whether or not I could make the output show a double with plot for the applicable data then display the rest as a string using addLabel.

Do custom quotes allow for that sort of flexibility? Or do I have to choose between a signed double or a string?

The reason is for sorting purposes of the output in scans.

if you want to confirm something, write a test study and try some variations.
that is what i do and how i learn. i did that below.

what i have seen, is that you have to use one or the other, not both at the same time, in the same cell.

the last test below, shows how to alternate between plot and label.

------------------

test watchlist study outputs

i modified a column study 5 ways and looked at what was displayed.
i was not able to use plot and label, to combine a number and text, in 1 column cell.

if plot and label are both used, the label data is displayed.
..it doesn't seem to matter which function is first.

if just 1 function is used, and the other is disabled, then it displays data from that function.
..if just a plot, then it displays a number
..if just a label, then text is displayed

in the last example, i wrote a formula that chooses plot or label

------------------------
the following is code i tried in a watchlist column
i did 5 variations.
each test, i changed the code and saved it with OK
------------------------
test1

plot then label,

plot z1 = close;
z1.setdefaultcolor(color.green);

addlabel(1, "test", color.cyan);
.....

displays,
word , test - font in cyan
no close price

------------------------
test2

label then plot,

addlabel(1, "test", color.cyan);

plot z1 = close;
z1.setdefaultcolor(color.green);
.....

displays,
word , test - font in cyan
no close price


------------------------
test3

just plot ( disable the label),

plot z1 = close;
z1.setdefaultcolor(color.green);

#addlabel(1, "test", color.cyan);
.....

displays,
close price , font is green
no test

------------------------
test4

just label (disable the plot),

#plot z1 = close;
#z1.setdefaultcolor(color.green);

addlabel(1, "test", color.cyan);
.....

displays,
word , test - font in cyan
no close price

------------------------
test5

test using either or
if close > $100 then plot a number price.
if close <= 100 then use a label to display 'test'


def na = double.nan;
# test outputs
def en = if close > 100 then 1 else 0;

plot z1 = if en then close else na;
z1.setdefaultcolor(color.green);

addlabel(!en, "test", color.cyan);
.....

this displays either a number or text

------------------------
hDkkiRB.jpg

------------------------


column study, adding padding characters to text, for sorting
https://usethinkscript.com/threads/how-to-separate-plot-function-from-addlabel-function.10456/
 
Thank you so much @halcyonguy for the definitive answer and analysis. I was thinking about the functionality I was looking for and I can actually achieve it by displaying the raw ratio instead of turning it into a percentage in the addLabel string.

This will work because most smaller ratios will now have a leading zero which will let me sort the scan results the way I was looking for. So now 10 percent will display as 0.10 and 2 percent as 0.02.

When I have those values displayed as percentages 10.0 will display below 2.0 percent because the high to low sorting uses the first symbol in the string and 2 > 1. Those leading zeros the output generates when the result is less than zero are the life saver here.
 
Regarding the future work that involves estimating the greeks there has already been a lovely script put together that would only need some very minor tweaks to incorporate into this code and provide the Delta, Gamma, Vega, and Theta at our times of interest. All input variables can be automated using GetStrike, GetDaysToExpiration, imp_volatility(GetUnderlyingSymbol()), and the strike spread using the bid ask functions.

Post in thread 'Option Greeks Calculation Labels for ThinkorSwim' https://usethinkscript.com/threads/option-greeks-calculation-labels-for-thinkorswim.399/post-2707
 
I just wanted to post this math I found from mobius in the thinkscript one drive that focuses in on the method he uses to approximate a standard normal distribution. It's brilliant, and it's the method he uses to approximate the options greeks in the in the post I shared above. Here is the link to the one note guide:

https://usethinkscript.com/threads/the-universe-of-thinkscript-your-one-stop-research-shop.300/

Code:
# Array Example

# Mobius

# 5.11.2017


# An array is a type of spreadsheet that data can be stored in

# and used for calculation outside the flow of the program

#

# This is an array example in TOS


# Standard Normal Cumulative Distribution Function (ND)

script ND {

    input c = close;

    input l = 252;

    def mean = Average(c, l);

    def SD = StDev(c, l);

    def Z_score = AbsValue((c - mean) / SD); # z score

# Abramowiz Stegun Approximation for Cumulative Normal Distribution

    plot zP = if Z_score > 6

          then 1

          else if Z_score < -6

               then 0

               else AbsValue(Z_score);

    def b1 =   .31938153;

    def b2 =  -.356563782;

    def b3 =  1.781477937;

    def b4 = -1.821255978;

    def b5 =  1.330274429;

    def p =    .2316419;

    def c2 =   .3989423;

    def a = zP;

    def t = 1.0 / (1.0 + a * p);

    def b = c2 * Exp((-a) * (a / 2));

    def n_a = ((((b5 * t + b4) * t + b3) * t + b2) * t + b1) * t;

    plot n = if a < 0

         then 1 - n_a

         else 1 - b * n_a;

}
 
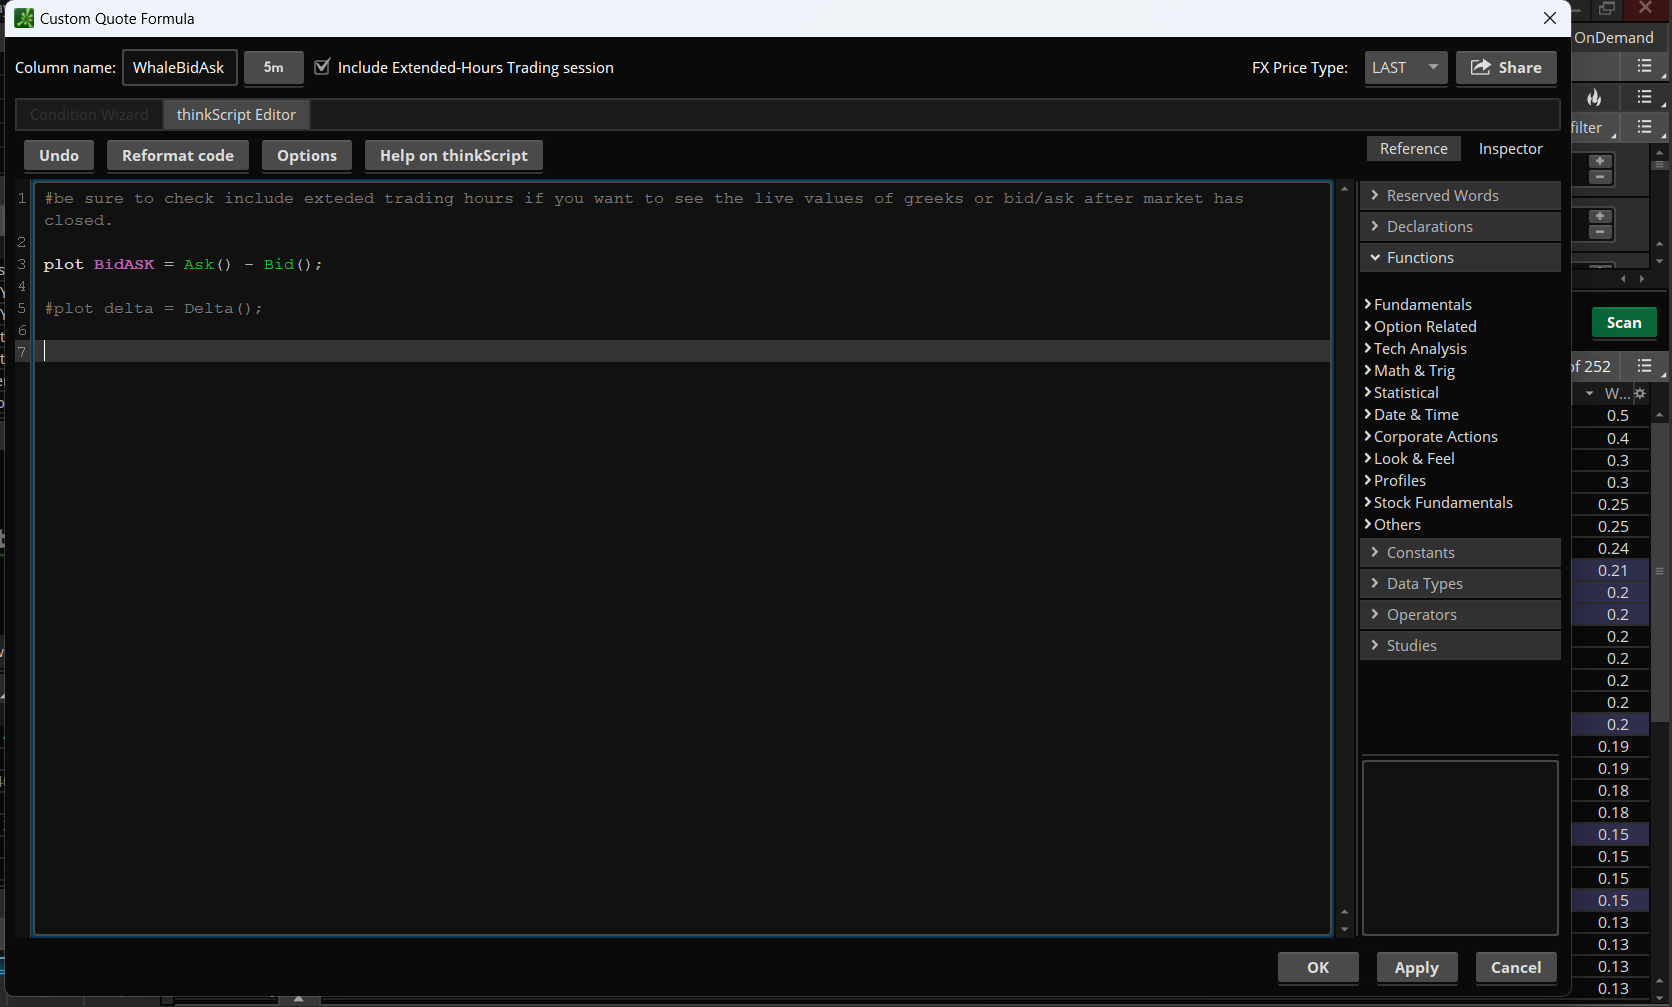
As I move forward I will be using the live spread in the mobius option code. An important behavior I just found out about is that if you want to pull the live values for options like the greeks or the bid/ask on an intraday time frame as we will be doing you MUST have Include Extended-Hours Trading session checked. This is because options marktets close after equities. If Include Extended-Hours Trading session is not checked while the market is closed the values shown below will return NaN. The column shown is that code to get the spread running successfully. Honestly, I didn't know about this quirk until now and thought these values only worked on a daily time frame.
dQObyII.png
 
Last edited:
As I play around with calcuting theoretical options price something I have noticed is that from time to time the theoretical price is way off the price the option is actually transacting at. Because we know the theoretical price and the real price I believe we have the opportunity to implement some error correcting to hammer down those outliers.

This is my theory for a very rough and dirty way to implement some error correcting of theoretical options calculations based on the real data we have:

-We definitively "know" all the inputs that go into calcuting theoretical option price. Two of them are weak however and they are:

1.)The use of implied volitility of the underlying. This is a generalization across all options and could be very wrong for a particular strike
2.) The use of a standard normal distribution. We know that real option pricing distribution can have significant skew.

Of those two assumptions the knob that we can turn to get our theoretical price closer to the real price given the data from a singular contract is 1.)

That logic looks something like this:

-If real option price is cheaper than the theoretical we "know" there is less Ivol baked into the real option then what we used in our calculations.
-If real option price is more expensive than the theoretical we "know" there is more Ivol baked into the real option then what we used in our calculations.

So error correcting based on the theoretical and real options price comes down to adjusting the Ivol used in the theoretical calculations based on how different the real and theoretical options price is.

In reality, there is some sort of skew to the distribution but we can't know that given the data we have access to. But I think modulating Ivol in this manner get us close to getting more accurate calculated greeks and final options price. Particularly in the case of outliers, think of this method as outlier protection more than anything else. The options prices we transact at are the end result of whatever complex models market makers are running. I'm looking to implement this method because I believe using this data can get our models much more in line with reality.

So, this is our dirty hack to improve our options pricing model:

1.)We calculate the percent difference between our theoretical option price, and the real option price from the data.

2.)We multiply our implied volitility of the underlying by that percentage and add it to the implied volitility of the underlying to get our "error corrected Ivol"

3.)We run our pricing model again with the "error corrected Ivol" and hopefully see results that are much closer to reality, particularly with outliers.

So that's the plan for my future work here. Hopefully we can get some good greeks at the time of the unusual activity. From there you have the opportunity to make a lot of neat signals.
I just wanted to write that I tried to attack this from mutiple angles and failed. Then I dug into black-Scholes and realized that IV is in fact the only missing factor. So, I tried to solve backwards for it, only to realize this is not simple and the topic of multiple research papers. In the end I will settle for the IV provided to us. Vol forecasting is an entire realm of advanced trading for a reason. At least I now know about stuff like Ito's lemma, stochastic calculus, Brownian motion, and have a pretty good handle on the general components of the black Scholes model. It's about the jouney, right.
 
Solution

Join useThinkScript to post your question to a community of 21,000+ developers and traders.

Similar threads

Not the exact question you're looking for?

Start a new thread and receive assistance from our community.

87k+ Posts
208 Online
Create Post

Similar threads

Similar threads

The Market Trading Game Changer

Join 2,500+ subscribers inside the useThinkScript VIP Membership Club
  • Exclusive indicators
  • Proven strategies & setups
  • Private Discord community
  • ‘Buy The Dip’ signal alerts
  • Exclusive members-only content
  • Add-ons and resources
  • 1 full year of unlimited support

Frequently Asked Questions

What is useThinkScript?

useThinkScript is the #1 community of stock market investors using indicators and other tools to power their trading strategies. Traders of all skill levels use our forums to learn about scripting and indicators, help each other, and discover new ways to gain an edge in the markets.

How do I get started?

We get it. Our forum can be intimidating, if not overwhelming. With thousands of topics, tens of thousands of posts, our community has created an incredibly deep knowledge base for stock traders. No one can ever exhaust every resource provided on our site.

If you are new, or just looking for guidance, here are some helpful links to get you started.

What are the benefits of VIP Membership?
VIP members get exclusive access to these proven and tested premium indicators: Buy the Dip, Advanced Market Moves 2.0, Take Profit, and Volatility Trading Range. In addition, VIP members get access to over 50 VIP-only custom indicators, add-ons, and strategies, private VIP-only forums, private Discord channel to discuss trades and strategies in real-time, customer support, trade alerts, and much more. Learn all about VIP membership here.
How can I access the premium indicators?
To access the premium indicators, which are plug and play ready, sign up for VIP membership here.
Back
Top