Gedhusek TrendFibonacci For ThinkOrSwim

NISSAVINIS

New member
Author states:
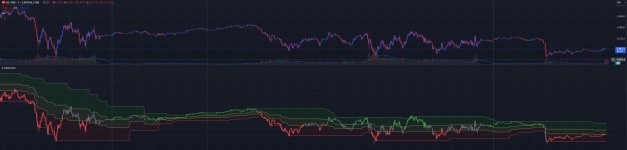
This indicator is a trend filter based on Fibonacci retracement levels

How to read:
  • There are three filled zones --> red, yellow and green
  • If the price is inside red zone, there is a downtrend on the market
  • If the price is inside the yellow zone, there is a sideways trend on the market
  • If the price is inside the green zone, there is a uptrend on the market
  • Also, candles are going to have a corresponding color based on the current trend

Calculations of the indicator:
1. Calculate distance between maximal and minimal price over the last "x" bars (choose value for "x" in inputs menu under the "Analysis period")
2. Use this distance for calculating two retracement levels (choose retracement levels in inputs menu)
3. These two retracement levels create an area of what is going to be considered as sideways market

Example:
  • Lets say we chose Analysis period of 100, Lower Fibonacci Level as 0.382 and Upper Fibonacci Level as 0.618
  • Maximum price over the last 100 bars was of 120 and minimum price was 20. That leaves us with the difference of 100 points
  • Now we calculate the Fibonacci levels --> 100*0.382 = 38.2 and 100*0.618 = 61.8
  • The next step is to add the levels to the lowest price point --> 20 + 38.2 = 58.2 and 20 + 61.8 = 81.8
  • And now we have our zones. If the price is going to be below the lower Fibonacci level (in this case 58.2), we consider it as a bearish trend. If the price is between those Fibonacci levels (58.2 and 81.8), we consider it as a sideways trend. And if the price is above the upper Fibonacci level (81.8), we consider it as a bullish trend.

Inputs:
  • Analysis period --> number of bars within which the system is going to look for max and min price
  • Lower Fibonacci Level --> Choose from options and must be lower or the same as "Upper Fibonacci Level"
  • Upper Fibonacci Level --> Choose from options and must be higher or the same as "Lower Fibonacci Level"
  • Show Filling --> whether you wish to fill the areas with color
  • Change Candle Color --> whether you wish to change the color of candles based on current trend.

6bPwOTY.png


Would like to get converted code in TOS indicator, scanner and watchlist column of below script if possible.
https://www.tradingview.com/script/JhZujkH3-Gedhusek-TrendFibonacci/
 
Last edited by a moderator:

Join useThinkScript to post your question to a community of 21,000+ developers and traders.

Would like to get converted code in TOS indicator, scanner and watchlist column of below script if possible.
https://www.tradingview.com/script/JhZujkH3-Gedhusek-TrendFibonacci/
check the below:

Upper Study:

CSS:
#// This source code is subject to the terms of the Mozilla Public License 2.0 at https://mozilla.org/MPL/2.0/
#// © Gedhusek
#indicator("Gedhusek TrendFibonacci",shorttitle="G FiboTrend",scale=scale.left)
# Converted by Sam4Cok@Samer800    - 05/2024 - Upper Study

input includeAverageTrueRange = no;
input source = close;
input AnalysisPeriod = 50; #,"Analysis Period")
input LowerFibonacciLevel = {"0.236", Default "0.382", "0.500", "0.618", "0.786"}; # "Lower Fibonacci Level"
input UpperFibonacciLevel = {"0.236", "0.382", "0.500", Default "0.618", "0.786"}; # "Upper Fibonacci Level"
input ShowFilling = yes; #(true,"Show Filling")
input colorBars = yes; #(true,"Change Candle Color")

def na = Double.NaN;
def lowerValue;def upperValue;
Switch (LowerFibonacciLevel) {
Case "0.236" : lowerValue = 0.236;
Case "0.500" : lowerValue = 0.500;
Case "0.618" : lowerValue = 0.618;
Case "0.786" : lowerValue = 0.786;
Default : lowerValue = 0.382;
}
Switch (UpperFibonacciLevel) {
Case "0.236" : upperValue = 0.236;
Case "0.382" : upperValue = 0.382;
Case "0.500" : upperValue = 0.500;
Case "0.786" : upperValue = 0.786;
Default : upperValue = 0.618;
}

def atr = if includeAverageTrueRange then atr(Length = 200) else 0;
def max = highest(source, AnalysisPeriod) + atr;
def min = lowest(source, AnalysisPeriod) - atr;

def lowerFib = min + (max-min) * lowerValue;
def upperFib = min + (max-min) * upperValue;
def ma = wma(source, 6);
def col = if ma > upperFib then 1 else if ma < lowerFib then -1 else 0;

plot maxLine = max; #,color=color.green)
plot minLine = min; #,color=color.red)
plot UpperFibLine = upperFib; #,color=color.rgb(228, 255, 75, 20))
plot LowerFibLine = lowerFib; #,color=color.rgb(228, 255, 75, 20))

maxLine.SetDefaultColor(Color.GREEN);
minLine.SetDefaultColor(Color.RED);
LowerFibLine.SetDefaultColor(Color.GRAY);
UpperFibLine.SetDefaultColor(Color.GRAY);

AddCloud(if ShowFilling then maxLine else na, UpperFibLine, Color.DARK_GREEN);
AddCloud(if ShowFilling then LowerFibLine else na, minLine, Color.DARK_RED);
AddCloud(if ShowFilling then UpperFibLine else na, LowerFibLine, Color.DARK_GRAY);

AssignPriceColor(if !colorBars then Color.CURRENT else
                 if col>0 then Color.GREEN else if col<0 then Color.RED else Color.GRAY);
#-- END of CODE

Lower Study:

CSS:
#// This source code is subject to the terms of the Mozilla Public License 2.0 at https://mozilla.org/MPL/2.0/
#// © Gedhusek
#indicator("Gedhusek TrendFibonacci",shorttitle="G FiboTrend",scale=scale.left)
# Converted by Sam4Cok@Samer800    - 05/2024
# updated - by Sam4Cok@Samer800    - 06/2024 - lower Study
declare lower;

input includeAverageTrueRange = no;
input source = close;
input AnalysisPeriod = 50; #,"Analysis Period")
input LowerFibonacciLevel = {"0.236", Default "0.382", "0.500", "0.618", "0.786"}; # "Lower Fibonacci Level"
input UpperFibonacciLevel = {"0.236", "0.382", "0.500", Default "0.618", "0.786"}; # "Upper Fibonacci Level"
input ShowFilling = yes; #(true,"Show Filling")
input colorBars = yes; #(true,"Change Candle Color")

def na = Double.NaN;
def lowerValue;def upperValue;
Switch (LowerFibonacciLevel) {
Case "0.236" : lowerValue = 0.236;
Case "0.500" : lowerValue = 0.500;
Case "0.618" : lowerValue = 0.618;
Case "0.786" : lowerValue = 0.786;
Default : lowerValue = 0.382;
}
Switch (UpperFibonacciLevel) {
Case "0.236" : upperValue = 0.236;
Case "0.382" : upperValue = 0.382;
Case "0.500" : upperValue = 0.500;
Case "0.786" : upperValue = 0.786;
Default : upperValue = 0.618;
}

def atr = if includeAverageTrueRange then atr(Length = 200) else 0;
def max = highest(source, AnalysisPeriod) + atr;
def min = lowest(source, AnalysisPeriod) - atr;

def lowerFib = min + (max-min) * lowerValue;
def upperFib = min + (max-min) * upperValue;
def ma = wma(source, 6);
def col = if ma > upperFib then 1 else if ma < lowerFib then -1 else 0;

plot maxLine = max; #,color=color.green)
plot minLine = min; #,color=color.red)
plot UpperFibLine = upperFib; #,color=color.rgb(228, 255, 75, 20))
plot LowerFibLine = lowerFib; #,color=color.rgb(228, 255, 75, 20))

maxLine.SetDefaultColor(Color.GREEN);
minLine.SetDefaultColor(Color.RED);
LowerFibLine.SetDefaultColor(Color.GRAY);
UpperFibLine.SetDefaultColor(Color.GRAY);

AddCloud(if ShowFilling then maxLine else na, UpperFibLine, Color.DARK_GREEN);
AddCloud(if ShowFilling then LowerFibLine else na, minLine, Color.DARK_RED);
AddCloud(if ShowFilling then UpperFibLine else na, LowerFibLine, Color.DARK_GRAY);

AssignPriceColor(if !colorBars then Color.CURRENT else
                 if col>0 then Color.GREEN else if col<0 then Color.RED else Color.GRAY);

#-- Candles
# Plot the new Chart
def hi = close > open;
def opCand = if hi then close else open;
def clCand = if hi then open else close;
def up = col>0;
def dn = col<0;
def nr = col==0;
AddChart(open = if up then opCand else na, high = high , low = low ,   close = clCand,
         type = ChartType.CANDLE, growcolor =  CreateColor(38,166,154));

AddChart(open = if nr then opCand else na, high = high , low = low , close = clCand,
         type = ChartType.CANDLE, growcolor =  Color.GRAY);

AddChart(open = if dn then opCand else na, high = high , low = low ,   close = clCand,
         type = ChartType.CANDLE, growcolor =  CreateColor(239,83,80));


#-- END of CODE
 
Last edited:
check the below:

CSS:
#// This source code is subject to the terms of the Mozilla Public License 2.0 at https://mozilla.org/MPL/2.0/
#// © Gedhusek
#indicator("Gedhusek TrendFibonacci",shorttitle="G FiboTrend",scale=scale.left)
# Converted by Sam4Cok@Samer800    - 05/2024

input includeAverageTrueRange = yes;
input source = close;
input AnalysisPeriod = 50; #,"Analysis Period")
input LowerFibonacciLevel = {"0.236", Default "0.382", "0.500", "0.618", "0.786"}; # "Lower Fibonacci Level"
input UpperFibonacciLevel = {"0.236", "0.382", "0.500", Default "0.618", "0.786"}; # "Upper Fibonacci Level"
input ShowFilling = yes; #(true,"Show Filling")
input colorBars = yes; #(true,"Change Candle Color")

def na = Double.NaN;
def lowerValue;def upperValue;
Switch (LowerFibonacciLevel) {
Case "0.236" : lowerValue = 0.236;
Case "0.500" : lowerValue = 0.500;
Case "0.618" : lowerValue = 0.618;
Case "0.786" : lowerValue = 0.786;
Default : lowerValue = 0.236;
}
Switch (UpperFibonacciLevel) {
Case "0.236" : upperValue = 0.236;
Case "0.382" : upperValue = 0.382;
Case "0.500" : upperValue = 0.500;
Case "0.786" : upperValue = 0.786;
Default : upperValue = 0.618;
}

def atr = if includeAverageTrueRange then atr(Length = 200) else 0;
def max = highest(source, AnalysisPeriod) + atr;
def min = lowest(source, AnalysisPeriod) - atr;

def lowerFib = min + (max-min) * lowerValue;
def upperFib = min + (max-min) * upperValue;
def ma = wma(source, 6);
def col = if ma > upperFib then 1 else if ma < lowerFib then -1 else 0;

plot maxLine = max; #,color=color.green)
plot minLine = min; #,color=color.red)
plot UpperFibLine = upperFib; #,color=color.rgb(228, 255, 75, 20))
plot LowerFibLine = lowerFib; #,color=color.rgb(228, 255, 75, 20))

maxLine.SetDefaultColor(Color.GREEN);
minLine.SetDefaultColor(Color.RED);
LowerFibLine.SetDefaultColor(Color.GRAY);
UpperFibLine.SetDefaultColor(Color.GRAY);

AddCloud(if ShowFilling then maxLine else na, UpperFibLine, Color.DARK_GREEN);
AddCloud(if ShowFilling then LowerFibLine else na, minLine, Color.DARK_RED);
AddCloud(if ShowFilling then UpperFibLine else na, LowerFibLine, Color.DARK_GRAY);

AssignPriceColor(if !colorBars then Color.CURRENT else
                 if col>0 then Color.GREEN else if col<0 then Color.RED else Color.GRAY);
#-- END of CODE
Hi @samer800 , can you please make a lower study version as shown in Tradingview? thank you very much.

What lower study version as shown in Tradingview?
It's version 5 and it looks like the file i have attached. Thank you
 

Attachments

  • 5.jpg
    5.jpg
    100.7 KB · Views: 126

Similar threads

Not the exact question you're looking for?

Start a new thread and receive assistance from our community.

87k+ Posts
468 Online
Create Post

Similar threads

Similar threads

The Market Trading Game Changer

Join 2,500+ subscribers inside the useThinkScript VIP Membership Club
  • Exclusive indicators
  • Proven strategies & setups
  • Private Discord community
  • ‘Buy The Dip’ signal alerts
  • Exclusive members-only content
  • Add-ons and resources
  • 1 full year of unlimited support

Frequently Asked Questions

What is useThinkScript?

useThinkScript is the #1 community of stock market investors using indicators and other tools to power their trading strategies. Traders of all skill levels use our forums to learn about scripting and indicators, help each other, and discover new ways to gain an edge in the markets.

How do I get started?

We get it. Our forum can be intimidating, if not overwhelming. With thousands of topics, tens of thousands of posts, our community has created an incredibly deep knowledge base for stock traders. No one can ever exhaust every resource provided on our site.

If you are new, or just looking for guidance, here are some helpful links to get you started.

What are the benefits of VIP Membership?
VIP members get exclusive access to these proven and tested premium indicators: Buy the Dip, Advanced Market Moves 2.0, Take Profit, and Volatility Trading Range. In addition, VIP members get access to over 50 VIP-only custom indicators, add-ons, and strategies, private VIP-only forums, private Discord channel to discuss trades and strategies in real-time, customer support, trade alerts, and much more. Learn all about VIP membership here.
How can I access the premium indicators?
To access the premium indicators, which are plug and play ready, sign up for VIP membership here.
Back
Top