Hello,
Gap Between Candles? The million dollar question.
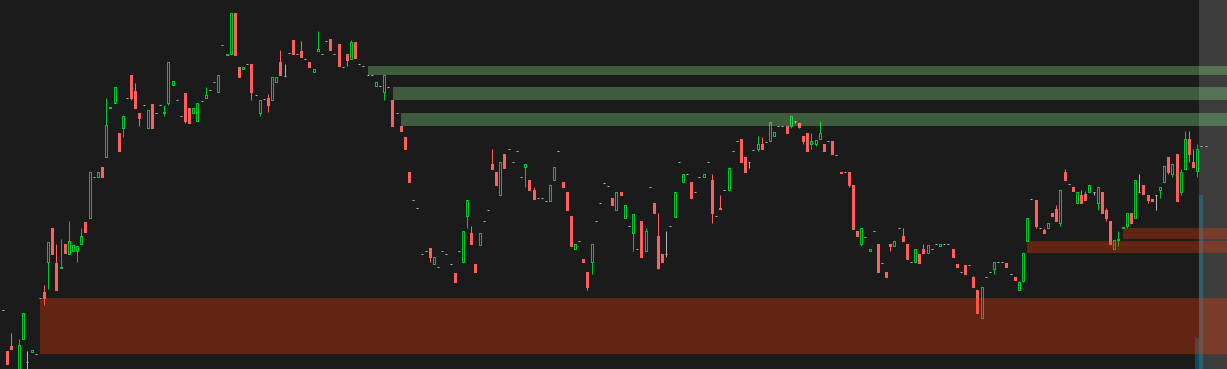
Is it possible to plot a cloud between any candle that leaves a visible gap between them. For example if a bullish candle closes at 130.00 and another bullish candle forms but it is opens at 130.15 leaving a .15 cent gap. Can a plot be made that displays that gap? I want to ignore the wicks. I'm only interested in the candle body.
This is the same for downward moves and any price action for that matter. The time frame to watch should be anything from 1 min up.
Gap Between Candles? The million dollar question.
Is it possible to plot a cloud between any candle that leaves a visible gap between them. For example if a bullish candle closes at 130.00 and another bullish candle forms but it is opens at 130.15 leaving a .15 cent gap. Can a plot be made that displays that gap? I want to ignore the wicks. I'm only interested in the candle body.
This is the same for downward moves and any price action for that matter. The time frame to watch should be anything from 1 min up.
Last edited by a moderator: