Picard
Member
Gann's Price & Time [Square The Range]
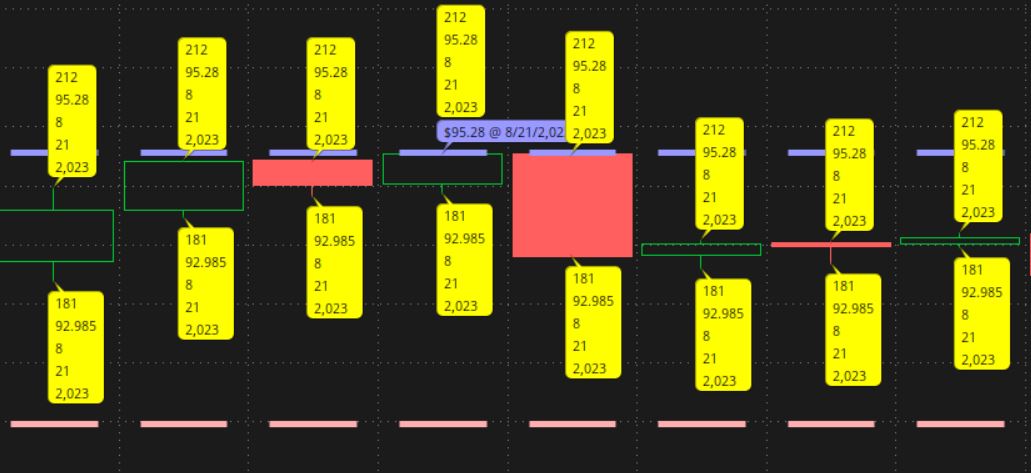
I'm scripting Gann's forecasting method to plot and display a calculated turning date, but I need help to capture the date and price that I've plotted in bubbles. Although I've found the high and low prices with their dates, I need help to capture those values into variables so that I can use them to continue to code in Gann's calculations. I'm including both the code below and the attached indicator file.
Code:
declare upper;
input numMonths1 = 5;
input VScale = 0.5;
input HScale = 5.0;
input GridSize = 50;
input Show1 = yes;
input lineWeight = 5;
def numdays = 21;
def numBars1 = numdays * numMonths1;
def barNum = if IsNaN( close ) then Double.NaN else BarNumber();
def lastBar = HighestAll( barNum );
def startBar1 = if lastBar <= numBars1 then 1 else lastBar - numBars1;
def bar = BarNumber();
def hData1 = If( barNum < startBar1, Double.NaN, high );
def lData1 = If( barNum < startBar1, Double.NaN, low );
def a_price = HighestAll(high);
def b_price = LowestAll(low);
def barnumber = BarNumber();
def c_price = if high == a_price then barnumber else Double.NaN;
def d_price = if low == b_price then barnumber else Double.NaN;
rec highnumber = CompoundValue(1, if IsNaN(c_price) then highnumber[1] else c_price, c_price);
def highnumberall = HighestAll(highnumber);
rec lownumber = CompoundValue(1, if IsNaN(d_price) then lownumber[1] else d_price, d_price);
def lownumberall = LowestAll(lownumber);
def months1 = Round( ( lastBar - startBar1 + 1 ) / 21, 0 );
plot HighestHigh1 = If( Show1, HighestAll( hData1 ), Double.NaN );
plot LowestLow1 = If( Show1, LowestAll( lData1 ), Double.NaN );
# ===============================================================
# Chart Bubbles
# ===============================================================
def BeginBarH = if barNum >= startBar1 and HighestAll(HighestHigh1) == high
then BarNumber() else BeginBarH[1];
def BeginBarL = if barNum >= startBar1 and HighestAll(LowestLow1) == low
then BarNumber() else BeginBarL[1];
def BeginBar = HighestAll(Min(BeginBarH, BeginBarL));
# ===============================================================
# Plotting Section
# ===============================================================
#===================[ Define Plot Appearences ]=====================
DefineGlobalColor( "H1", Color.VIOLET);
DefineGlobalColor( "L1", Color.PINK);
HighestHigh1.SetPaintingStrategy( PaintingStrategy.DASHES );
HighestHigh1.SetLineWeight( lineWeight );
HighestHigh1.AssignValueColor( GlobalColor( "H1" ) );
HighestHigh1.HideBubble();
LowestLow1.SetPaintingStrategy( PaintingStrategy.DASHES );
LowestLow1.SetLineWeight( lineWeight );
LowestLow1.AssignValueColor( GlobalColor( "L1" ) );
LowestLow1.HideBubble();
AddChartBubble( Show1 and barNum == BeginBarH, HighestHigh1, "$" + HighestHigh1 + " @ " + GetMonth() + "/" + GetDayOfMonth(GetYYYYMMDD()) + "/" + GetYear(), GlobalColor( "H1" ), yes );
AddChartBubble( Show1 and barNum == BeginBarL, LowestLow1, "$" + LowestLow1 + " @ " + GetMonth() + "/" + GetDayOfMonth(GetYYYYMMDD()) + "/" + GetYear(), GlobalColor( "L1" ), no );
# ===============================================================
# Calculate Price & Time Forecast
# ===============================================================