#gann_3day_low_high_stoploss
#https://usethinkscript.com/threads/gann-3-day-low-or-high.18875/
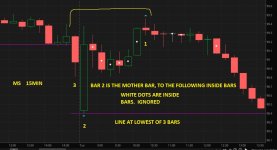
#Gann 3-Day Low or High
#3 day low,
#find peaks. find the highest high, that will be bar1
#find mother bars for inside bars, smaller future bars. count how many inside bars after the mother bar
#look at prev bars. find bar2 and bar3
#skip inside bars , smaller than prev non inside , countable bars
#stop is lowest of those 3 bars
#=======================================
#=======================================
# peaks
#peaksvalleys_robert_03_updated
#https://usethinkscript.com/threads/zigzag-high-low-with-supply-demand-zones-for-thinkorswim.172/#post-7048
#post10
#robert
# define peaks / valleys
def na = Double.NaN;
def bn = BarNumber();
#def lastBar = HighestAll(if IsNaN(close) then 0 else bn);
def lastbn = HighestAll(if IsNaN(close) then 0 else bn);
def lastbar = bn == lastbn;
#def lastbar = (!isnan(close) and isnan(close[-1]));
def highx = high;
def lowx = low;
input pkval_length = 7;
def offset = Min(pkval_length - 1, lastbn - bn);
def peak = highx > Highest(highx[1], pkval_length - 1) and highx == GetValue(Highest(highx, pkval_length), -offset);
def valley = lowx < Lowest(lowx[1], pkval_length - 1) and lowx == GetValue(Lowest(lowx, pkval_length), -offset);
input pkval_arrows = yes;
def y1 = 0.002;
plot zpk = if pkval_arrows and peak then high*(1+y1) else na;
plot zval = if pkval_arrows and valley then low*(1-y1) else na;
zpk.SetPaintingStrategy(PaintingStrategy.SQUARES);
#zpk.SetPaintingStrategy(PaintingStrategy.BOOLEAN_WEDGE_up);
zpk.SetDefaultColor(Color.cyan);
zpk.SetLineWeight(2);
zpk.HideBubble();
zval.SetPaintingStrategy(PaintingStrategy.SQUARES);
#zval.SetPaintingStrategy(PaintingStrategy.BOOLEAN_WEDGE_down);
zval.SetDefaultColor(Color.cyan);
zval.SetLineWeight(2);
zval.HideBubble();
#=======================================
#=======================================
# inside bars
def hi = high;
def lo = low;
# find inside bars
# look at future bars for smaller bars
# white dots on inside bars , skipped
def n = 100;
# count how many inside bars after mother bar
def inside_qty = fold i = 1 to n
with p
while (high > getvalue(high,-i) and low < getvalue(low,-i))
do p + 1;
def ismother = inside_qty > 0;
# after mother bar, count down over the inside bars
def cntdown = if ismother and cntdown[1] < 0 then inside_qty
else if cntdown[1] > 0 then cntdown[1] - 1
else -1;
def insidebar = if cntdown >= 0 and cntdown[1] >= 0 then 1 else 0;
# inside bars
plot zin = if insidebar then MidBodyVal() else na;
zin.SetPaintingStrategy(PaintingStrategy.points);
zin.AssignValueColor(Color.WHITE);
zin.SetLineWeight(3);
zin.HideBubble();
#------------------------
# inside bars horz lines
input test_inside_lines = no;
def insidehi = if cntdown >= 0 and !insidebar then high
else if cntdown >= 0 then insidehi[1]
else na;
def insidelo = if cntdown >= 0 and !insidebar then low
else if cntdown >= 0 then insidelo[1]
else na;
plot zinhi = if test_inside_lines then insidehi else na;
zinhi.AssignValueColor(Color.WHITE);
zinhi.HideBubble();
plot zinlo = if test_inside_lines then insidelo else na;
zinlo.AssignValueColor(Color.WHITE);
zinlo.HideBubble();
#=======================================
#=======================================
# look for a future peak
# count the bars to the peak
# are there (barz - 1) future valid bars (not inside bars) before it?
def barz = 3;
def bar3 = fold f = 0 to n
with q = 1
while !getvalue(peak, -f)
do q + (if getvalue(insidebar, -f) then 0 else 1);
def big = 99999;
# find lowest low
def lolo = if bn == 1 then na
else if bar3 == bar3[-1] then lolo[1]
else if bar3 == barz and bar3 != bar3[-1] then (
fold g = 0 to bar3
with r = big
do min(r, getvalue(low,-g))
) else lolo[1];
plot z1 = lolo;
z1.SetPaintingStrategy(PaintingStrategy.horizontal);
z1.AssignValueColor(Color.magenta);
z1.HideBubble();
# show bar #s
def upcnt = if bar3 == barz and !insidebar then barz
else if !insidebar then upcnt[1] - 1
else upcnt[1];
plot zupcnt = if upcnt > 0 and upcnt != upcnt[1] then upcnt else na;
zupcnt.SetPaintingStrategy(PaintingStrategy.VALUES_ABOVE);
#x.SetPaintingStrategy(PaintingStrategy.VALUES_below);
zupcnt.AssignValueColor(Color.white);
#=======================================
#=======================================
input inside_bar_count_bubble = no;
addchartbubble(inside_bar_count_bubble and ismother, low,
inside_qty
,color.yellow, no);
# inside bars count down
addchartbubble(0, low,
cntdown
, color.cyan, no);
def t = 0;
addchartbubble(bar3 == barz and t, low,
bar3
#bar3 + " b3\n" +
#insidebar + " in\n" +
#(getvalue(peak, - bar3)) + " pk\n" +
#bar3_low
#" "
, (if lolo then color.cyan else color.gray), no);
#, (if bar3_low then color.cyan else color.gray), no);
addchartbubble(0,low,
cntdown
, color.magenta, no);
#