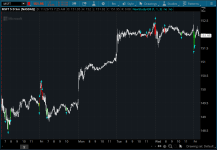
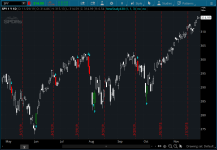
This indicator can be used on any timeframe to find potential turning points.


thinkScript Code
Code:
# Franklin ATR Bar
# Assembled by BenTen at useThinkScript.com
# Converted by https://www.tradingview.com/script/9z7kUar2-franklin-atr-bar-highlight-by-els-robotfarm-ru/

input i = 1;
input a = 1;
input o = 3;

def ema65=expAverage(close,65);
def atrover= high-atr(15)*a;
def atrunder= low+atr(15)*a;

def isover = (if i==2 then low else close) < atrover and close>ema65 and close-ema65<atr(15)*o;
def isunder = (if i==2 then high else close) > atrunder and close<ema65 and ema65-close<atr(15)*o;

# Plot Signals
plot bullish = isunder;
bullish.SetPaintingStrategy(PaintingStrategy.BOOLEAN_ARROW_UP);
bullish.SetDefaultColor(Color.CYAN);
bullish.SetLineWeight(1);
plot bearish = isover;
bearish.SetPaintingStrategy(PaintingStrategy.BOOLEAN_ARROW_DOWN);
bearish.SetDefaultColor(Color.CYAN);
bearish.SetLineWeight(1);

# Add # in front of the assignPriceColor below if you don't want to paint your candles
assignPriceColor(if isover then color.red else if isunder then color.green else color.white);

