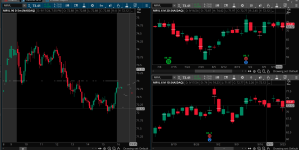
Hello, I'm looking for some help with the below script. This script is what i use for identifying support and resistance levels on the daily, two days and weekly chart. The script works flawless but what i want to do is simplify the process by having the levels extended forward to the current trading day on the daily TF and on smaller time frames. Also if i run the script on smaller TF other than what is set in the script, then the script plots for every session instead of only the sessions that had higher vol on the HTF and plots broken up like in the image attached. I've tried several ideas but i can't get the levels to extend forward or keep it from plotting on every session on the smaller TF. Thanks in advance.
declare upper;
input Period = AggregationPeriod.DAY;
input price = VWAP;
input length2 = 1;
input length = 14;
input allowNegativeValues = no;
def rawRelVol = (volume - Average(volume, length)) / StDev(volume, length);
def RelVol = if allowNegativeValues then rawRelVol else Max(0, rawRelVol);
def VWAP = Average(data = vwap (PERIOD = Period),length = length2);
plot data = if (RelVol is greater than .001) then VWAP else 0;
data.SetPaintingStrategy(PaintingStrategy.HORIZONTAL);
data.SetLineWeight(1);