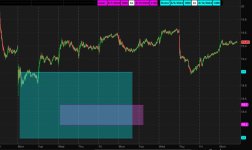
if you are trying to manually draw 1 rectangle (partially) covering another, you may find that 1 of them covers up the other one.
this uses clouds , to draw 2 rectangles, that should allow both of them to be seen.
you pick the start and stop: dates, times, and prices.
the smaller rectangle is called the inner one
the bigger rectangle is called the outer one.
it doesn't check if the dates or times exist.
can choose the color for rectangles
can turn on labels to show dates/times
can show price levels
pick a $20 stock to see the default values drawn. i used T
ref , a question from this post
https://usethinkscript.com/threads/tos-drawing-rectangles-in-a-rectangle.19332/
this uses clouds , to draw 2 rectangles, that should allow both of them to be seen.
you pick the start and stop: dates, times, and prices.
the smaller rectangle is called the inner one
the bigger rectangle is called the outer one.
it doesn't check if the dates or times exist.
can choose the color for rectangles
can turn on labels to show dates/times
can show price levels
pick a $20 stock to see the default values drawn. i used T
Code:
#draw_rectangles

#https://usethinkscript.com/threads/tos-drawing-rectangles-in-a-rectangle.19332/
#TOS Drawing Rectangles in a Rectangle

# test with  T ,  a $19 stock

def na = double.nan;
def bn = barnumber();
def ymd = GetYYYYMMDD();

#DefineGlobalColor("outer", color.cyan);
#DefineGlobalColor("inner", color.magenta);
# GlobalColor("outer")
# GlobalColor("inner")

# color choose
#  this doesn't assign the color in quotes.
#  the location of the picked color , in the series, is changed to a number for getcolor()
input inner_color = {default "magenta", "cyan", "pink", "gray", "orange", "red", "green", "dark_gray", "tan", "white"};
input outer_color = {"magenta", default "cyan", "pink", "gray", "orange", "red", "green", "dark_gray", "tan", "white"};

# inner rect------------
input inner_rect_start_date_YYYYMMDD = 20240807;
#input inner_rect_stop_date_YYYYMMDD = 20240809;
input inner_rect_stop_date_YYYYMMDD = 20240813;
input times_are_EST = 0;
input inner_rect_start_time_HHMM = 1000;
input inner_rect_stop_time_HHMM = 1100;
input inner_rect_price_higher = 18.5;
input inner_rect_price_lower = 18.2;

def xin = if (ymd == inner_rect_start_date_YYYYMMDD and SecondsFromTime(inner_rect_start_time_HHMM) >= 0) then 1
 else if (ymd > inner_rect_start_date_YYYYMMDD and ymd < inner_rect_stop_date_YYYYMMDD) then 1
 else if (ymd == inner_rect_stop_date_YYYYMMDD and SecondsTillTime(inner_rect_stop_time_HHMM) > 0) then 1
 else 0;

def cldin = if xin then inner_rect_price_higher else na;
#addcloud(cldin, inner_rect_price_lower, GlobalColor("inner"));
addcloud(cldin, inner_rect_price_lower, getcolor(inner_color));


# outer rect------------
input outer_rect_start_date_YYYYMMDD = 20240805;
input outer_rect_stop_date_YYYYMMDD = 20240812;
input outer_rect_start_time_HHMM = 1000;
input outer_rect_stop_time_HHMM = 1400;
input outer_rect_price_higher = 19.0;
input outer_rect_price_lower = 18.0;

def xout = if (ymd == outer_rect_start_date_YYYYMMDD and SecondsFromTime(outer_rect_start_time_HHMM) >= 0) then 1
 else if (ymd > outer_rect_start_date_YYYYMMDD and ymd < outer_rect_stop_date_YYYYMMDD) then 1
 else if (ymd == outer_rect_stop_date_YYYYMMDD and SecondsTillTime(outer_rect_stop_time_HHMM) > 0) then 1
 else 0;

def cldout = if xout then outer_rect_price_higher else na;
#addcloud(cldout, outer_rect_price_lower, GlobalColor("outer"));
addcloud(cldout, outer_rect_price_lower, getcolor(outer_color));

#------------------------

# label calcs
def data1 = inner_rect_start_date_YYYYMMDD;
def year1 = Round(data1/10000, 0);
def month1 = Round((data1 % 10000) / 100, 0);
def day1 = (data1 % 100);

def data2 = inner_rect_stop_date_YYYYMMDD;
def year2 = Round(data2/10000, 0);
def month2 = Round((data2 % 10000) / 100, 0);
def day2 = (data2 % 100);

def data3 = outer_rect_start_date_YYYYMMDD;
def year3 = Round(data3/10000, 0);
def month3 = Round((data3 % 10000) / 100, 0);
def day3 = (data3 % 100);

def data4 = outer_rect_stop_date_YYYYMMDD;
def year4 = Round(data4/10000, 0);
def month4 = Round((data4 % 10000) / 100, 0);
def day4 = (data4 % 100);


input show_dates = yes;
addlabel(show_dates, " ", color.black);
addlabel(show_dates, "inner ", getcolor(inner_color));
addLabel(show_dates, month1 + "/" + day1 + "/" + AsPrice(year1), getcolor(inner_color));
addlabel(show_dates, asprice(inner_rect_start_time_HHMM), getcolor(inner_color));
addlabel(show_dates, " to ", color.white);
addLabel(show_dates, month2 + "/" + day2 + "/" + AsPrice(year2), getcolor(inner_color));
addlabel(show_dates, asprice(inner_rect_stop_time_HHMM), getcolor(inner_color));
addlabel(show_dates, " ", color.black);

addlabel(show_dates, "Outer", getcolor(outer_color));
addLabel(show_dates, month3 + "/" + day3 + "/" + AsPrice(year3), getcolor(outer_color));
addlabel(show_dates, asprice(outer_rect_start_time_HHMM), getcolor(outer_color));
addlabel(show_dates, " to ", color.white);
addLabel(show_dates, month4 + "/" + day4 + "/" + AsPrice(year4), getcolor(outer_color));
addlabel(show_dates, asprice(outer_rect_stop_time_HHMM), getcolor(outer_color));
addlabel(show_dates, " ", color.black);

input show_price_levels = yes;
plot xl1 = if xin and show_price_levels then inner_rect_price_higher else na;
plot xl2 = if xin and show_price_levels then inner_rect_price_lower else na;
xl1.setdefaultcolor(getcolor(inner_color));
xl2.setdefaultcolor(getcolor(inner_color));
plot xl3 = if xout and show_price_levels then outer_rect_price_higher else na;
plot xl4 = if xout and show_price_levels then outer_rect_price_lower else na;
xl3.setdefaultcolor(getcolor(outer_color));
xl4.setdefaultcolor(getcolor(outer_color));
#
ref , a question from this post
https://usethinkscript.com/threads/tos-drawing-rectangles-in-a-rectangle.19332/