Evaluation of a new Strategy

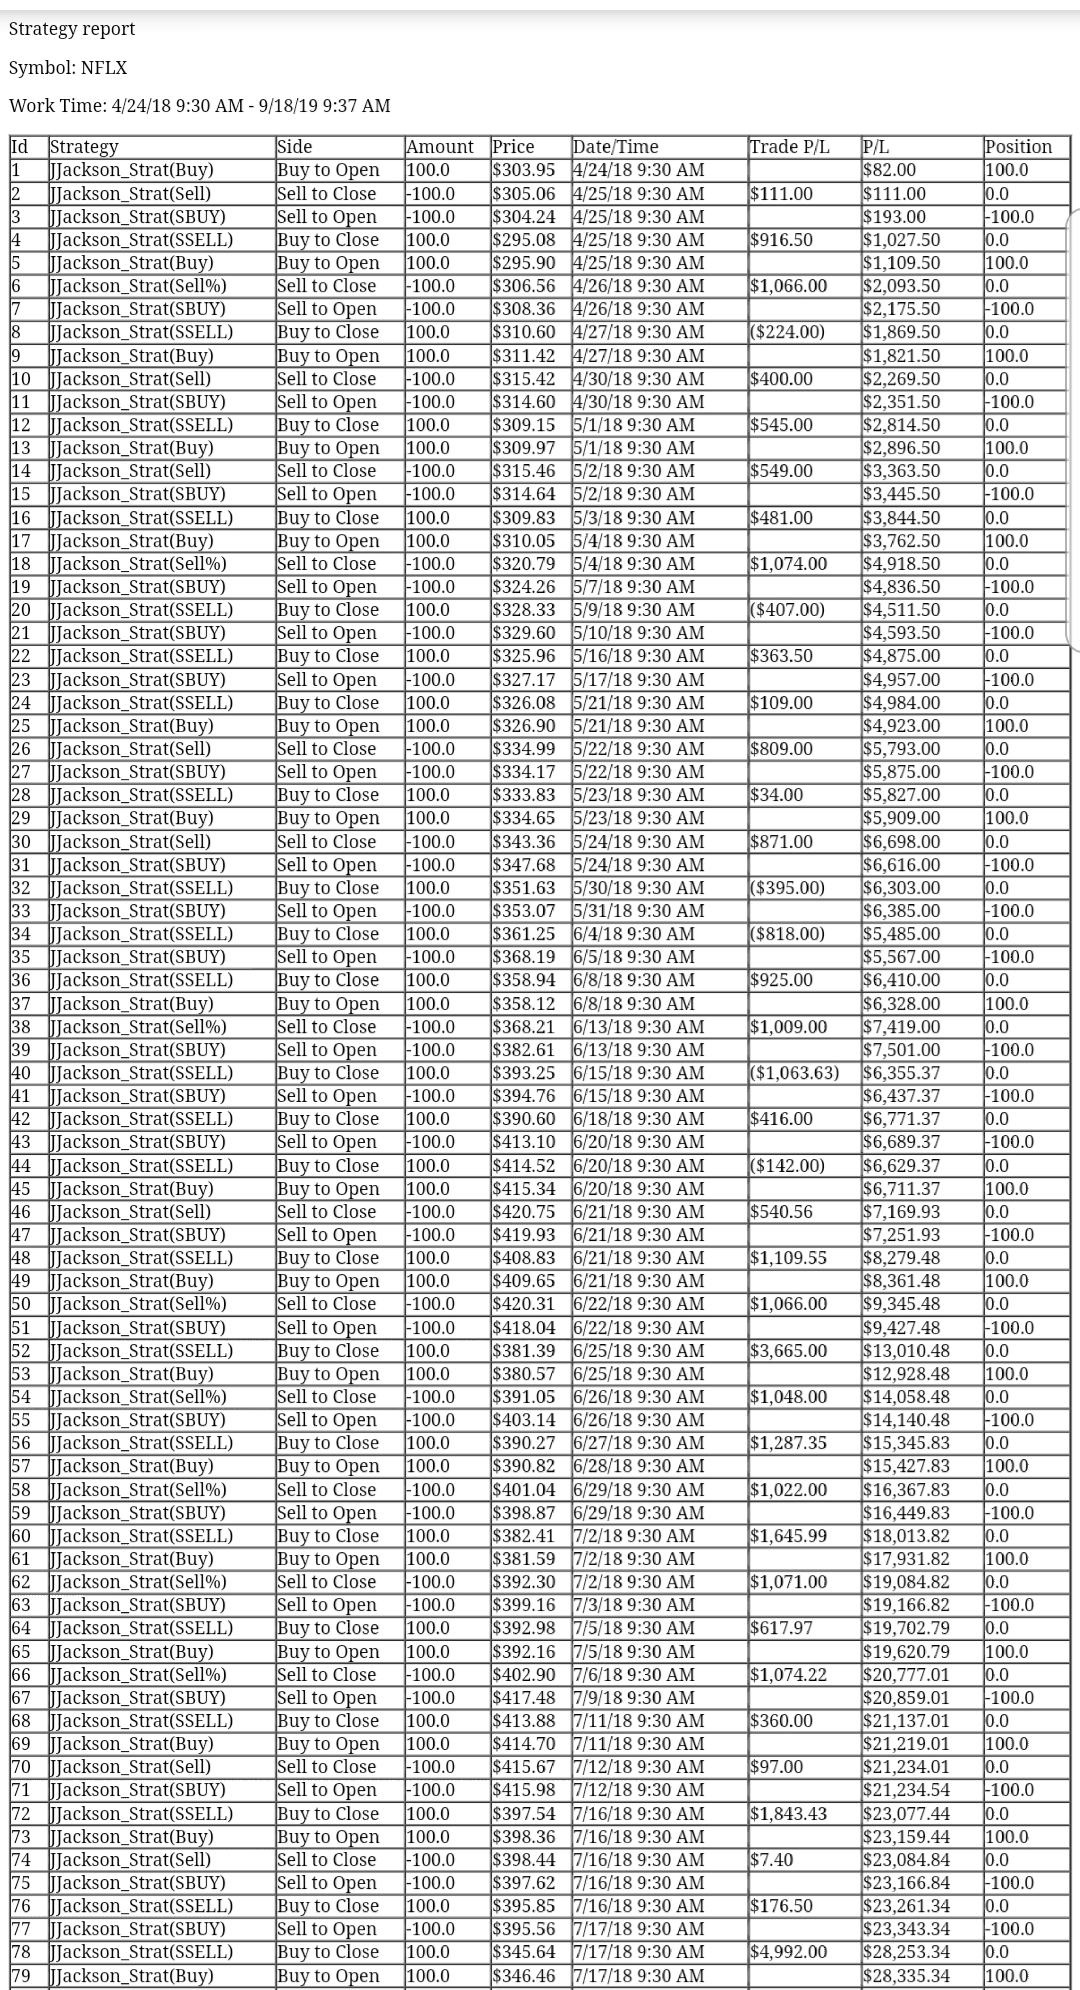
Thanks for the add! I am new to most of this, except for coding and mathematics. I recently got interested in trading and wrote a Strategy. I would like help evaluating this strategy as I streamline and perfect it. Pretty much looking for information that will tell me if what I have written is decent, average, or cutting edge. I'm sure it's not the latter... lol
  1. What is an average or above average profitable/successful trade ratio based on the better strategies shared on this site?
  2. What are some of the highest percent gains obtained with a backtesting strategy in TOS to date? (Interested in averages over multiple stocks over longer periods of time) Obviously if shorted NFLX last week could have an impressive two day gain....
  3. The native strategies that are installed on TOS, are they considered average?
 
Last edited:
@FL_Mech_Engineer it would help us if we had more information.
What is your trading / investing time frame? Will the strategy fit your time frame or is there bias?
Short stocks as well? How's your discipline and patience? I'd be a gazillionaire if I had just enough...

After answering those questions, you may be best served by posting your Strat and having our Strat Testers run the numbers.
You may be going at it backwards because we don't know the type of stocks to invest in or your planned hold time? I hope that makes sense.
 

Join useThinkScript to post your question to a community of 21,000+ developers and traders.

The code is still a work in progress, so would rather finish what I am doing before start sharing it. Here are some results of some of the reports.

I cant seem to upload pics... where do you upload your files to in order to share?


ACM - Past 90 Days - 100 contracts default (limit 1 order)
Total P/L: $1,962.25
33 Orders

NFLX - Past 90 Days - 100 contracts default (limit 1 order)
Total P/L: $23,170.61
19 Orders

NFLX - Past 360 Days - 100 contracts default (limit 1 order)
Total P/L: $164,685
361 Orders

/NQ - Jun 27th - July 17th - 2 contracts default (limit 1 order)
Total P/L: $32,030
35 Orders


See what I mean...... Pretty insane numbers - what's the catch?
 
Last edited:
Never said I wouldnt share but I'm not really asking for help creating the code although I'm sure there is plenty to learn from everyone on here who certainly knows more than me.

Perhaps if I re-phrase....

What types of real world gains can one expect compared to a backtested strategy that claims 30% gains per month?
 
30%/month is a great result, esp if its consistent!
But...tos auto strats execute at levels you may need be able to execute at and the size you want, may not be available.

Maybe, fund your account and run the strat with real money and see how you do. I've found losing money is the best educator.
Good luck!
 
0QXzpwW.jpg


k2Prpbr.jpg


jDwTrjm.jpg
 

Attachments

  • 0QXzpwW.jpg
    0QXzpwW.jpg
    195.5 KB · Views: 86
  • jDwTrjm.jpg
    jDwTrjm.jpg
    192.7 KB · Views: 78
  • k2Prpbr.jpg
    k2Prpbr.jpg
    187.8 KB · Views: 84
Last edited by a moderator:
What types of real world gains can one expect compared to a backtested strategy that claims 30% gains per month?
It depends how good your overall trading system is : stock selection, size, exits and execution
Having something indicator(even backtested) is not a trading system.
Overall if you can get consistent 30% return on your capital - thats great system you could easily become multi-millionaire with. Its pretty hard to develop such system though.

And btw zigzag indicator is delayed (e.g. calculates pivots only after they happened ). So its not possible to use it for generating entry signals in real time
 
something everyone overlooks in win/loss are breakeven trades, so a 51% win rate with a 10% loss, balance b/e is great. Increasing trades also increases your chances of higher profits.

If you poke around and search for virtu ipo reviews, I have the analysis somewhere, but the basic table output looks like this -

# Trades Per Day/ Daily Edge (pd 100)/ Odds of a Protable Week
1 /51.0%/ 51.9%
100 /57.9% /67.0%
1,000 /73.5%/ 92.1%
10,000 /97.8% /99.999%
100,000 /99.999999% /100%
800,000/ 100% /100%
 
Do you have 2 instances of DMA on your charts? For strategies, I always like to use 1 contract to get things in Unit terms (you can always scale up). Helpful also for comparing returns against different instruments. Looks also like your sell to open is labeled a buy. I like to use green/red for long buy/sell, and yellow/magenta for sell/buy trades to easily see the long trades vs short trades. TOS strategy does only open a trade after a bar is closed that generates a signal, but you can use a study to flash possible signals before the strategy fires. Curious to see what you've been building @FL_Mech_Engineer Would need to see the strategy report also to ensure TOS is calculating things as expected...
 
It depends how good your overall trading system is : stock selection, size, exits and execution
Having something indicator(even backtested) is not a trading system.
Overall if you can get consistent 30% return on your capital - thats great system you could easily become multi-millionaire with. Its pretty hard to develop such system though.

And btw zigzag indicator is delayed (e.g. calculates pivots only after they happened ). So its not possible to use it for generating entry signals in real time

What is the Zig Zag indicator?
 
30%/month is a great result, esp if its consistent!
But...tos auto strats execute at levels you may need be able to execute at and the size you want, may not be available.

Maybe, fund your account and run the strat with real money and see how you do. I've found losing money is the best educator.
Good luck!
Hey @codydog Welcome! Any idea what the math teacher in the lounge might say? Markos
 
Do you have 2 instances of DMA on your charts? For strategies, I always like to use 1 contract to get things in Unit terms (you can always scale up). Helpful also for comparing returns against different instruments. Looks also like your sell to open is labeled a buy. I like to use green/red for long buy/sell, and yellow/magenta for sell/buy trades to easily see the long trades vs short trades. TOS strategy does only open a trade after a bar is closed that generates a signal, but you can use a study to flash possible signals before the strategy fires. Curious to see what you've been building @FL_Mech_Engineer Would need to see the strategy report also to ensure TOS is calculating things as expected...

KGmm2SW.jpg


jfLsjuZ.jpg


UT7zc9D.jpg


tE2DsyW.jpg
 

Attachments

  • tE2DsyW.jpg
    tE2DsyW.jpg
    1.6 MB · Views: 80
  • UT7zc9D.jpg
    UT7zc9D.jpg
    1.1 MB · Views: 78
  • jfLsjuZ.jpg
    jfLsjuZ.jpg
    687 KB · Views: 75
Last edited by a moderator:
You have to drop this, looks promising. What indicators did you implement into it or how did you determine what you coded?

I'm still working out the details, but in due time. I looked into the Zig Zag indicator and this does not use pivot highs or pivot lows to trigger buy sell. I will go see if I can zoom in and show it triggering one before a pivot. I took a popular momentum indicator and used a common geometry formula to trigger one portion of the condition, the other portion is simply some logic to make sure price is larger than Entryprice() (or smaller on the short) so you may see it hold a stock for a while with no activity. And there is some stop loss functionality although right now it's still getting some pretty large magnitude losses.
 
I'm still working out the details, but in due time. I looked into the Zig Zag indicator and this does not use pivot highs or pivot lows to trigger buy sell. I will go see if I can zoom in and show it triggering one before a pivot. I took a popular momentum indicator and used a common geometry formula to trigger one portion of the condition, the other portion is simply some logic to make sure price is larger than Entryprice() (or smaller on the short) so you may see it hold a stock for a while with no activity. And there is some stop loss functionality although right now it's still getting some pretty large magnitude losses.
And yes, I do have two different instances of DMA plotted, and referenced.
 
Hey @codydog Welcome! Any idea what the math teacher in the lounge might say? Markos
In another thread on this site, a member was looking at /NQ with similar too good to be true gains and if I understood it correctly he was referencing the open price instead of close which made it a recursive strategy? I reference the close, but I dont quite understand what a recursive strategy is
something everyone overlooks in win/loss are breakeven trades, so a 51% win rate with a 10% loss, balance b/e is great. Increasing trades also increases your chances of higher profits.

If you poke around and search for virtu ipo reviews, I have the analysis somewhere, but the basic table output looks like this -

# Trades Per Day/ Daily Edge (pd 100)/ Odds of a Protable Week
1 /51.0%/ 51.9%
100 /57.9% /67.0%
1,000 /73.5%/ 92.1%
10,000 /97.8% /99.999%
100,000 /99.999999% /100%
800,000/ 100% /100%
That is very interesting.
Some of the evaluation I am doing compares different aggregations, of course. And while most all aggregations worked, some were better than others especially if consider commissions. On the 360 chart, adjusting aggregations such that ~360 orders took near the highest profit, but more importantly it minimized commission % of profit. Not to mention making less than 5 trades per day is VERY appealing, to me anyhow.
 
AGREED! That is what prompted this thread in first place, WAY too good to be true. I started trading it yesterday in papermoney ln a slow aggregation, shorted ACM. As soon as ACM bottoms out I will trade it on the bull run with real money.
 

Similar threads

Not the exact question you're looking for?

Start a new thread and receive assistance from our community.

87k+ Posts
584 Online
Create Post

Similar threads

Similar threads

The Market Trading Game Changer

Join 2,500+ subscribers inside the useThinkScript VIP Membership Club
  • Exclusive indicators
  • Proven strategies & setups
  • Private Discord community
  • ‘Buy The Dip’ signal alerts
  • Exclusive members-only content
  • Add-ons and resources
  • 1 full year of unlimited support

Frequently Asked Questions

What is useThinkScript?

useThinkScript is the #1 community of stock market investors using indicators and other tools to power their trading strategies. Traders of all skill levels use our forums to learn about scripting and indicators, help each other, and discover new ways to gain an edge in the markets.

How do I get started?

We get it. Our forum can be intimidating, if not overwhelming. With thousands of topics, tens of thousands of posts, our community has created an incredibly deep knowledge base for stock traders. No one can ever exhaust every resource provided on our site.

If you are new, or just looking for guidance, here are some helpful links to get you started.

What are the benefits of VIP Membership?
VIP members get exclusive access to these proven and tested premium indicators: Buy the Dip, Advanced Market Moves 2.0, Take Profit, and Volatility Trading Range. In addition, VIP members get access to over 50 VIP-only custom indicators, add-ons, and strategies, private VIP-only forums, private Discord channel to discuss trades and strategies in real-time, customer support, trade alerts, and much more. Learn all about VIP membership here.
How can I access the premium indicators?
To access the premium indicators, which are plug and play ready, sign up for VIP membership here.
Back
Top