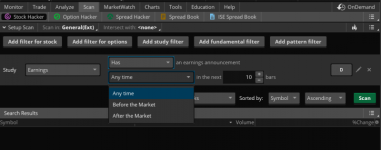
Earnings scan to display only after market close

15minofpham

New member
Would anyone know how to tweak this to show Earnings After Close from last night and Before market for today?

Thanks!

Code:
input days = 1; 

declare once_per_bar;  

plot scan = sum(HasEarnings(EarningTime.AFTER_MARKET),days)[1-days] + 

sum(HasEarnings(EarningTime.BEFORE_MARKET),days)[0-days] > 0; 
 
Last edited:
Solution
@15minofpham Are you looking for this?

XR6XWCm.png


More earnings scripts here:
Last edited:
Solution

Join useThinkScript to post your question to a community of 21,000+ developers and traders.

I got this off of your One Note sticky post from Chris Baker from 2013. This is what he said.

I created this because the default TOS Earnings filter is useless for actually highlighting earnings plays.  For example, when set to 2 days,  it includes both stocks that already had earnings this morning, as well as those that won't release until tomorrow afternoon. 

TODAY'S POTENTIAL EARNINGS PLAYS - Shows only stocks with earnings tonight or tomorrow morning 

Scan tab study that selects stocks with earnings either after the market today or before the market opens tomorrow.

The problem with his scan is that it only looks into the future. I was playing with days such as -1 to try to get last night's earnings but it didn't work. I'm looking for a way to scan for earnings After the Market FROM LAST NIGHT & Before the market from today. TOS default After the market earnings scan is for tonight, NOT last night. Hope this makes sense.
 
Last edited by a moderator:
@15minofpham A lot has changed in TOS since 2013. Look again at BenTen's picture above. Ben has it correct. Otherwise search the OneNote with the word "til" in the context of earnings. It may take a bit, but the syntax you need will be there. But, as I stated, Ben has it correct above, you just need to work with it.

 
Last edited:
I finally figured it out on my first ever TOS script (albeit with a head start from Chris). This scan is for the prior day's AFTER MARKET and today's BEFORE MARKET.

Code:
input days = 1;
declare once_per_bar;
plot scan = sum(HasEarnings(EarningTime.AFTER_MARKET),days)[1] +
sum(HasEarnings(EarningTime.BEFORE_MARKET),days) > 0;
 
Last edited:
@Likos There isn't a set up per se. The reason why I need this scan is because I like to play the opening range breakout after the initial 30 minutes. It was cumbersome for me to have separate After Market scan from the previous night and Before Market. I guess another way one can play is to look for a gap up or gap down then wait for a higher/lower move in its respective direction.

 
Last edited:
@Likos I use the ORB script here on this site. Earnings has been a fading game. Most don't go higher after their initial 30 so instead, I've been using for gaps where I put it in a watch list to see if there's a continuation.

 
Last edited:
@Likos My modification is a lot better. The default automatically changes the next day meaning the After Market is now for that day, NOT the previous night.

 
Last edited:
@markos

Rich (BB code):
(Cindy was one of the original script masters that worked for TOS)
#HINT: watchlist label that shows days-to-earnings and next earnings date (if next earnings date is available).  Includes a visual alert if "EARNINGS TODAY"

#def allows you to teach ThinkScript new "words" to save time and typing by using your new "words" later in the code

def bn = BarNumber();

def na = Double.NaN;

def getNextEarnings = AbsValue(GetEventOffset(Events.EARNINGS, 0));

def findDay = GetDayOfMonth(GetYYYYMMDD());

def findMonth = GetMonth();

def findYear = GetYear();


#ThinkScript thinks in numbers, including converting dates into numbers and viewing each bar on the chart as a number.  Therefore you can use BarNumber to tell ThinkScript which bar, and use lines in ThinkScript code to 'trick' ThinkScript into displaying that daily bar in date format

def getNextEarningsBarNumber = if !isNaN(getNextEarnings) then bn + getNextEarnings else na;

def NextEarnings = bn == HighestAll(getNextEarningsBarNumber);

def getNextEarningsMonth = HighestAll(if NextEarnings then findMonth else na);

def getNextEarningsDay = HighestAll(if NextEarnings then findDay else na);

def getNextEarningsYear = HighestAll(if NextEarnings then findYear else na);


#plot tells ThinkScript what data you want displayed.  Hide() is used in this case because desired display is the label and not the numberic equivalent of the data

plot DaysToEarnings = getNextEarningsBarNumber;

DaysToEarnings.Hide();


#AddLabel makes the data more user friendly when viewing the watchlist column

AddLabel(if getNextEarnings > 1 then yes else no, getNextEarnings + ";" + " Date= " + (getNextEarningsMonth) + "-"+ (getNextEarningsDay) + "-" + AsPrice((getNextEarningsYear)) , Color.BLACK);

AssignBackgroundColor(color.LIGHT_GRAY);


#because of the condition at beginning of AddLabel, if today is earnings date then days-to-earnings label will be hidden and this visual alert label will be visible

AddLabel(if getNextEarnings == 0 then yes else no, "  EARNINGS TODAY !!!", color.RED);

Here is another Earnings Watchlist, sorry, no .mx available

Rich (BB code):
# blt
# 10.27.2016

# Plots the # of days to next earnings with before/after market coloring.
# It appears that the watchlist has a limitation of around 30 days into
# the future. So anything with earnings already reported or greater than
# 29 days are indicated as "NaN".

def ebm = fold i = 0 to 90

          with value = 0

          while value == 0

          do if GetValue(HasEarnings(type = EarningTime.BEFORE_MARKET), -i) then 1 else ebm[1];

plot getNextEarnings = if AbsValue(GetEventOffset(Events.EARNINGS, 0)) > 29

                       then Double.NaN

                       else AbsValue(GetEventOffset(Events.EARNINGS, 0));

getNextEarnings.AssignValueColor(if ebm == 1 then Color.GREEN else Color.RED);

I merged the other topic into this one so it's easier to browse and find things.
 
Last edited:

Similar threads

Not the exact question you're looking for?

Start a new thread and receive assistance from our community.

87k+ Posts
253 Online
Create Post

Similar threads

Similar threads

The Market Trading Game Changer

Join 2,500+ subscribers inside the useThinkScript VIP Membership Club
  • Exclusive indicators
  • Proven strategies & setups
  • Private Discord community
  • ‘Buy The Dip’ signal alerts
  • Exclusive members-only content
  • Add-ons and resources
  • 1 full year of unlimited support

Frequently Asked Questions

What is useThinkScript?

useThinkScript is the #1 community of stock market investors using indicators and other tools to power their trading strategies. Traders of all skill levels use our forums to learn about scripting and indicators, help each other, and discover new ways to gain an edge in the markets.

How do I get started?

We get it. Our forum can be intimidating, if not overwhelming. With thousands of topics, tens of thousands of posts, our community has created an incredibly deep knowledge base for stock traders. No one can ever exhaust every resource provided on our site.

If you are new, or just looking for guidance, here are some helpful links to get you started.

What are the benefits of VIP Membership?
VIP members get exclusive access to these proven and tested premium indicators: Buy the Dip, Advanced Market Moves 2.0, Take Profit, and Volatility Trading Range. In addition, VIP members get access to over 50 VIP-only custom indicators, add-ons, and strategies, private VIP-only forums, private Discord channel to discuss trades and strategies in real-time, customer support, trade alerts, and much more. Learn all about VIP membership here.
How can I access the premium indicators?
To access the premium indicators, which are plug and play ready, sign up for VIP membership here.
Back
Top