nerdytrader
New member
I was wondering if someone could point me in the right direction pertaining to how I could go about defining a time range that triggers a plot to change it's position on the x axis.
I've been working on refining my basic OHLC horizontal line code so it works well on all intraday timeframes.
I know how to plot any hortizontal line from any point on the x axis, for example from 200am to the right axis, or 8:14 to the right axis, Etc.
But I can't figure out how to dynamically change an x axis position based on the time of the day.
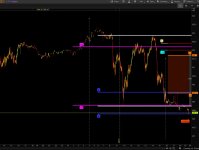
I would like to plot the intraday High and Low, between the time of 9:30am and 12:00pm, to begin at 600am and plot all the way to the price axis -
then after the time crosses 1200pm, I want the line to begin plotting from 930am on the x axis.
The reason for this is to eliminate clutter on the chart, organize the line lengths for my personal preference.
For whatever reason, I can't seem to make the code plot once the time crosses 1200pm. It only plots from one or the other time I define / plot.
My code is as followed:
input ExtendHL = yes;
input HideHL = no;
script pBars {
input pClose = close;
def pBars = if pClose != pClose[1]
then pClose[1] else pBars[1];
plot PriorBar = pBars;
}
def PrevRTH = pBars(RTH);
def xPrevRT = HighestAll(PrevRTH);
def PrevGlobex = pBars(Globex);
def xPrevGlobex = HighestAll(PrevGlobex);
def xGlobex = HighestAll(Globex);
def RegHrs = HighestAll(RTH);
def xHigh = high(period = Day);
def xLow = low(period = Day);
def Nan = Double.NaN;
def Bar = BarNumber();
def Axis = IsNaN(close);
def Today = GetDay() == GetLastDay();
def After600 = Today and SecondsFromTime(600) >= 0;
#***********Daily High
def High1 = (HighestAll(if Bar >= RegHrs and Bar < xGlobex then xhigh
else if xGlobex < RegHrs and Bar >= RegHrs then high else Nan));
plot HighRT = if !Today then Nan else if ExtendHL and After600 then High1 else if Axis then High1 else Nan ;
#***********Daily Low
def Low1 = (LowestAll(if Bar >= RegHrs and Bar < xGlobex then xlow
else if xGlobex < RegHrs and Bar >= RegHrs then low else Nan));
plot LowRT = if !Today then Nan else if ExtendHL and After600 then Low1 else if Axis then Low1 else Nan ;
######################
That is the code that plots the intraday High and Low. It plots from 600am and extends to the price axis.
I'd like for the plots to automatically switch from extending from 600am to extending from 930am once the intraday time has crossed 1200pm.
After the time crosses 1200pm, I would like the lines to remain extended from 930am until the time crosses 930am the following day, then which
it would again revert back to extending from the 600am time.
I hope I have properly explained what I'd like to achieve. If anyone can help me with this, I would greatly appreciate it. Thanks in advance!

