


The Dynamic Grid Indicator is an advanced technical indicator created by BigBeluga to map volatility-based grid channels across price charts while simultaneously plotting a synchronized multi-level oscillator pane. Traditional envelope indicators often use static standard deviation bands that fail to adjust to shifting trend momentum or localized price congestion. In order to provide a solution to this problem, this indicator combines a Hull Moving Average (HMA) central baseline with Average True Range (ATR) multiplier steps, automatically fading channel lines and generating precise crossover signals when price interacts with structural grid borders.
The indicator aims to visualize volatility expansion, compression, and overextended momentum zones.
Chart bubbles, Colored candles and Dashboard can be turned ON/OFF in the settings. The number of bands can also be selected in the settings.
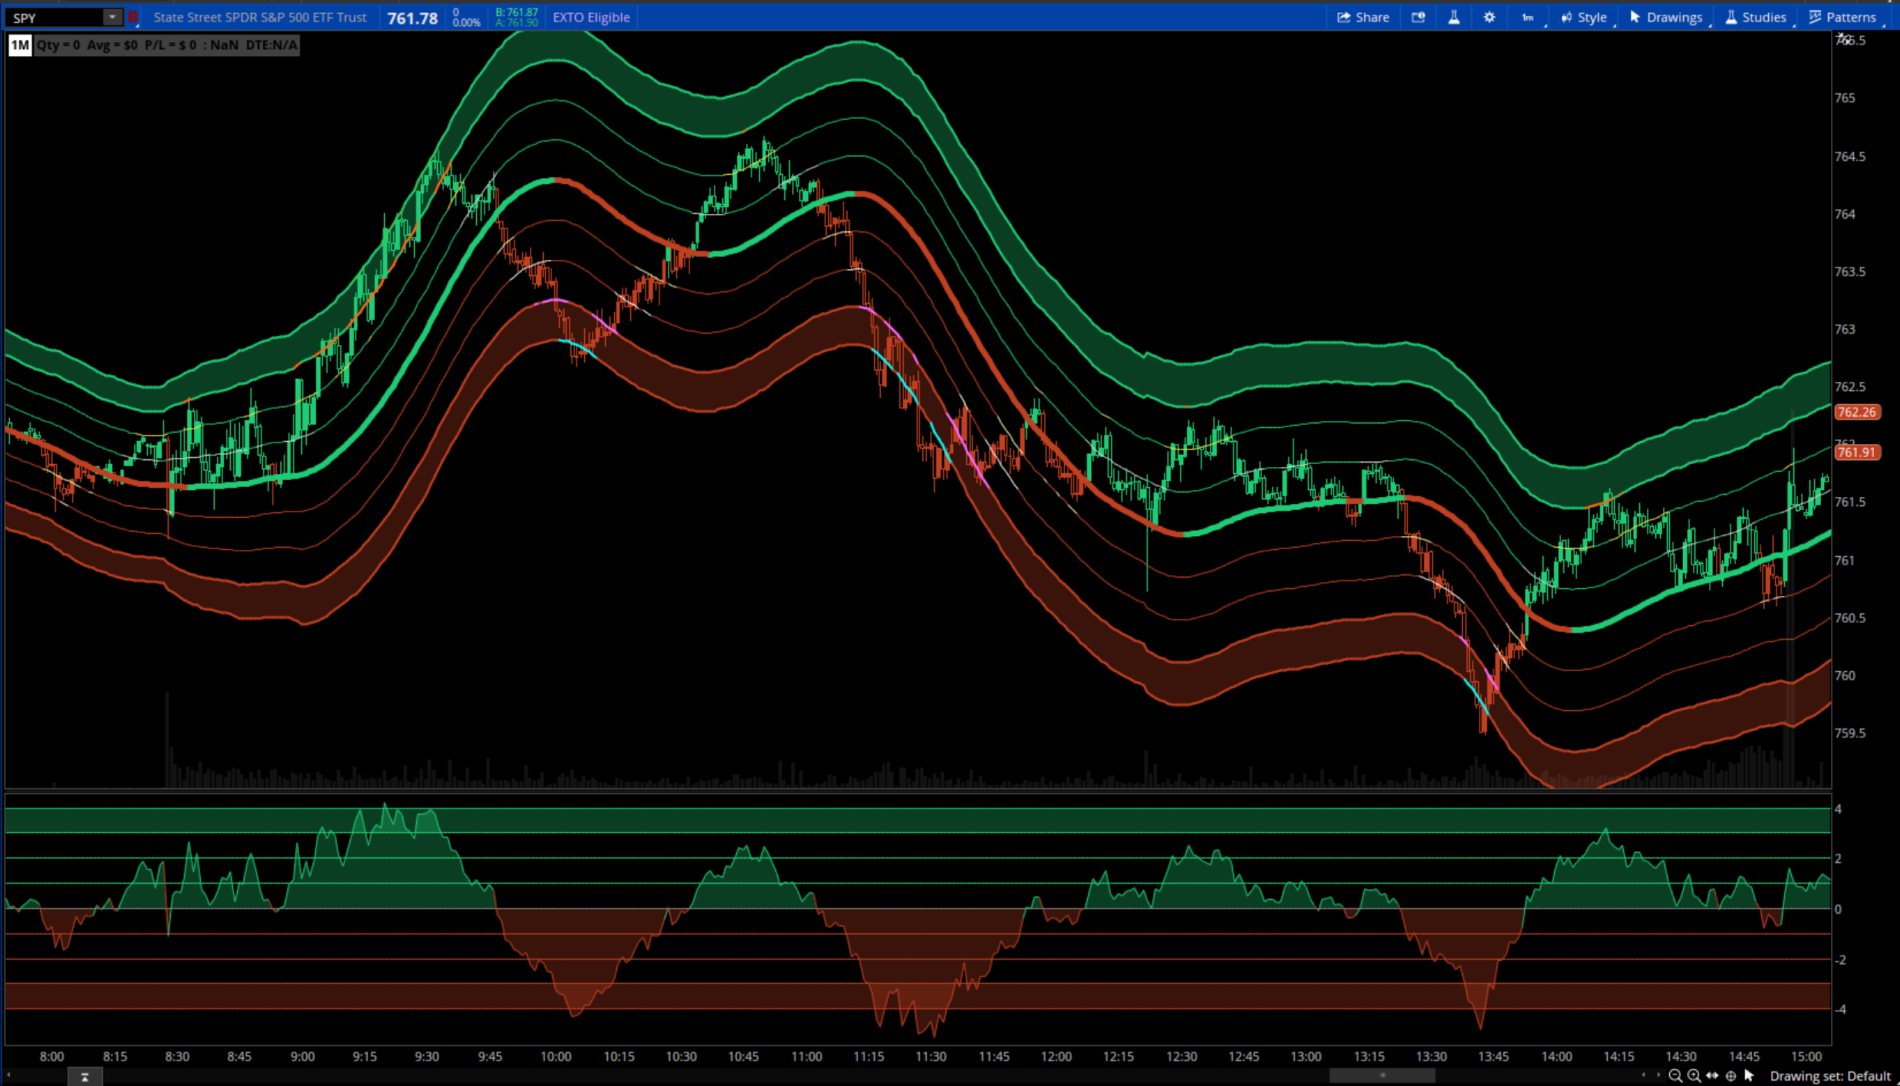
SPY 1 min chart.
UPPER INDICATOR:
LOWER INDICATOR:
The indicator aims to visualize volatility expansion, compression, and overextended momentum zones.
Chart bubbles, Colored candles and Dashboard can be turned ON/OFF in the settings. The number of bands can also be selected in the settings.
SPY 1 min chart.
UPPER INDICATOR:
Code:
# Dynamic Grid Indicator Upperchart
# Converted from BigBeluga "Dynamic Grid Indicator [BigBeluga]"
# Original: https://www.tradingview.com/script/WKSKrMsu-Dynamic-Grid-Indicator-BigBeluga/
# Conversion by Chewie 9/2/2026

declare upper;

# ── INPUTS ────────────────────────────────────────────────────────────────────
input colorCandles = yes;
input showDash    = no;
input showSignals = no;
input hmaLength   = 150;
input atrLength   = 100;
input atrMult     = 1.6;
input numLevels   = 4;        # 1–5
input thresholdP  = 0.5;      # Proximity sensitivity (fraction of one ATR step)
input minGap      = 10;       # Min bars between signals


# ── COLORS ────────────────────────────────────────────────────────────────────
DefineGlobalColor("Bull",      CreateColor(30, 204, 117));
DefineGlobalColor("Bear",      CreateColor(192, 64, 32));

# Upper levels — teal, graduated transparency (more opaque = outer level)
DefineGlobalColor("U1",        CreateColor(30, 204, 117));   # 85% → ~opaque
DefineGlobalColor("U2",        CreateColor(30, 204, 117));
DefineGlobalColor("U3",        CreateColor(30, 204, 117));
DefineGlobalColor("U4",        CreateColor(30, 204, 117));
DefineGlobalColor("U5",        CreateColor(30, 204, 117));

# Lower levels — maroon, graduated
DefineGlobalColor("D1",        CreateColor(192, 64, 32));
DefineGlobalColor("D2",        CreateColor(192, 64, 32));
DefineGlobalColor("D3",        CreateColor(192, 64, 32));
DefineGlobalColor("D4",        CreateColor(192, 64, 32));
DefineGlobalColor("D5",        CreateColor(192, 64, 32));

# ── CORE CALCULATIONS ─────────────────────────────────────────────────────────
def centerLine = HullMovingAvg(close, hmaLength);
def atrRaw     = WildersAverage(TrueRange(high, close, low), atrLength);
def atrVal     = atrRaw * atrMult;
def proxDist   = atrVal * thresholdP;

# ── GRID LEVELS ───────────────────────────────────────────────────────────────
def upper1 = centerLine + atrVal * 1;
def upper2 = centerLine + atrVal * 2;
def upper3 = centerLine + atrVal * 3;
def upper4 = centerLine + atrVal * 4;
def upper5 = centerLine + atrVal * 5;

def lower1 = centerLine - atrVal * 1;
def lower2 = centerLine - atrVal * 2;
def lower3 = centerLine - atrVal * 3;
def lower4 = centerLine - atrVal * 4;
def lower5 = centerLine - atrVal * 5;

# ── PROXIMITY HIDE LOGIC ──────────────────────────────────────────────────────
# Returns 1 if price is "near" the level (any of close/open/hl2/hlc3/hlcc4)
def hl2v   = (high + low) / 2;
def hlc3v  = (high + low + close) / 3;
def hlcc4v = (high + low + close + close) / 4;

def nearU1 = AbsValue(close - upper1) <= proxDist or AbsValue(open - upper1) <= proxDist or AbsValue(hl2v - upper1) <= proxDist or AbsValue(hlc3v - upper1) <= proxDist or AbsValue(hlcc4v - upper1) <= proxDist;
def nearU2 = AbsValue(close - upper2) <= proxDist or AbsValue(open - upper2) <= proxDist or AbsValue(hl2v - upper2) <= proxDist or AbsValue(hlc3v - upper2) <= proxDist or AbsValue(hlcc4v - upper2) <= proxDist;
def nearU3 = AbsValue(close - upper3) <= proxDist or AbsValue(open - upper3) <= proxDist or AbsValue(hl2v - upper3) <= proxDist or AbsValue(hlc3v - upper3) <= proxDist or AbsValue(hlcc4v - upper3) <= proxDist;
def nearU4 = AbsValue(close - upper4) <= proxDist or AbsValue(open - upper4) <= proxDist or AbsValue(hl2v - upper4) <= proxDist or AbsValue(hlc3v - upper4) <= proxDist or AbsValue(hlcc4v - upper4) <= proxDist;
def nearU5 = AbsValue(close - upper5) <= proxDist or AbsValue(open - upper5) <= proxDist or AbsValue(hl2v - upper5) <= proxDist or AbsValue(hlc3v - upper5) <= proxDist or AbsValue(hlcc4v - upper5) <= proxDist;

def nearD1 = AbsValue(close - lower1) <= proxDist or AbsValue(open - lower1) <= proxDist or AbsValue(hl2v - lower1) <= proxDist or AbsValue(hlc3v - lower1) <= proxDist or AbsValue(hlcc4v - lower1) <= proxDist;
def nearD2 = AbsValue(close - lower2) <= proxDist or AbsValue(open - lower2) <= proxDist or AbsValue(hl2v - lower2) <= proxDist or AbsValue(hlc3v - lower2) <= proxDist or AbsValue(hlcc4v - lower2) <= proxDist;
def nearD3 = AbsValue(close - lower3) <= proxDist or AbsValue(open - lower3) <= proxDist or AbsValue(hl2v - lower3) <= proxDist or AbsValue(hlc3v - lower3) <= proxDist or AbsValue(hlcc4v - lower3) <= proxDist;
def nearD4 = AbsValue(close - lower4) <= proxDist or AbsValue(open - lower4) <= proxDist or AbsValue(hl2v - lower4) <= proxDist or AbsValue(hlc3v - lower4) <= proxDist or AbsValue(hlcc4v - lower4) <= proxDist;
def nearD5 = AbsValue(close - lower5) <= proxDist or AbsValue(open - lower5) <= proxDist or AbsValue(hl2v - lower5) <= proxDist or AbsValue(hlc3v - lower5) <= proxDist or AbsValue(hlcc4v - lower5) <= proxDist;

# ── CENTER LINE PLOT ──────────────────────────────────────────────────────────
plot HMA = centerLine;
HMA.SetLineWeight(2);
HMA.AssignValueColor(if centerLine > centerLine[1] then GlobalColor("Bull") else GlobalColor("Bear"));

plot HMAGlow = centerLine;
HMAGlow.SetLineWeight(5);
HMAGlow.AssignValueColor(if centerLine > centerLine[1] then CreateColor(30, 204, 117) else CreateColor(192, 64, 32));
HMAGlow.SetStyle(Curve.FIRM);
HMAGlow.SetPaintingStrategy(PaintingStrategy.LINE);

AssignPriceColor(if !colorCandles then Color.CURRENT
            else if close >= centerLine then GlobalColor("Bull")
            else GlobalColor("Bear"));

# ── UPPER GRID PLOTS ──────────────────────────────────────────────────────────
plot U1 = if numLevels >= 1 then upper1 else Double.NaN;
U1.AssignValueColor(if nearU1 then Color.CURRENT else GlobalColor("U1"));
U1.SetLineWeight(1);
U1.HideBubble();

plot U2 = if numLevels >= 2 then upper2 else Double.NaN;
U2.AssignValueColor(if nearU2 then Color.CURRENT else GlobalColor("U2"));
U2.SetLineWeight(1);
U2.HideBubble();

plot U3 = if numLevels >= 3 then upper3 else Double.NaN;
U3.AssignValueColor(if nearU3 then Color.CURRENT else GlobalColor("U3"));
U3.SetLineWeight(2);
U3.HideBubble();

plot U4 = if numLevels >= 4 then upper4 else Double.NaN;
U4.AssignValueColor(if nearU4 then Color.CURRENT else GlobalColor("U4"));
U4.SetLineWeight(2);
U4.HideBubble();

plot U5 = if numLevels >= 5 then upper5 else Double.NaN;
U5.AssignValueColor(if nearU5 then Color.CURRENT else GlobalColor("U5"));
U5.SetLineWeight(2);
U5.HideBubble();

# ── LOWER GRID PLOTS ──────────────────────────────────────────────────────────
plot D1 = if numLevels >= 1 then lower1 else Double.NaN;
D1.AssignValueColor(if nearD1 then Color.CURRENT else GlobalColor("D1"));
D1.SetLineWeight(1);
D1.HideBubble();

plot D2 = if numLevels >= 2 then lower2 else Double.NaN;
D2.AssignValueColor(if nearD2 then Color.CURRENT else GlobalColor("D2"));
D2.SetLineWeight(1);
D2.HideBubble();

plot D3 = if numLevels >= 3 then lower3 else Double.NaN;
D3.AssignValueColor(if nearD3 then Color.CURRENT else GlobalColor("D3"));
D3.SetLineWeight(2);
D3.HideBubble();

plot D4 = if numLevels >= 4 then lower4 else Double.NaN;
D4.AssignValueColor(if nearD4 then Color.CURRENT else GlobalColor("D4"));
D4.SetLineWeight(2);
D4.HideBubble();

plot D5 = if numLevels >= 5 then lower5 else Double.NaN;
D5.AssignValueColor(if nearD5 then Color.CURRENT else GlobalColor("D5"));
D5.SetLineWeight(2);
D5.HideBubble();

# ── SIGNALS ───────────────────────────────────────────────────────────────────
def crossBear1 = close crosses below upper1;
def crossBear2 = close crosses below upper2;
def crossBear3 = close crosses below upper3;
def crossBear4 = close crosses below upper4;
def crossBear5 = close crosses below upper5;

def crossBull1 = close crosses above lower1;
def crossBull2 = close crosses above lower2;
def crossBull3 = close crosses above lower3;
def crossBull4 = close crosses above lower4;
def crossBull5 = close crosses above lower5;

def rawBear = (crossBear1 and numLevels >= 1) or
              (crossBear2 and numLevels >= 2) or
              (crossBear3 and numLevels >= 3) or
              (crossBear4 and numLevels >= 4) or
              (crossBear5 and numLevels >= 5);

def rawBull = (crossBull1 and numLevels >= 1) or
              (crossBull2 and numLevels >= 2) or
              (crossBull3 and numLevels >= 3) or
              (crossBull4 and numLevels >= 4) or
              (crossBull5 and numLevels >= 5);

# Minimum bar gap cooldown

def bearSig = rawBear and !rawBear[1] and Sum(rawBear, minGap)[1] == 0;
def bullSig = rawBull and !rawBull[1] and Sum(rawBull, minGap)[1] == 0;

# Bear level string (highest triggered)
def bearLvl = if crossBear5 and numLevels >= 5 then -5
         else if crossBear4 and numLevels >= 4 then -4
         else if crossBear3 and numLevels >= 3 then -3
         else if crossBear2 and numLevels >= 2 then -2
         else -1;

def bullLvl = if crossBull5 and numLevels >= 5 then 5
         else if crossBull4 and numLevels >= 4 then 4
         else if crossBull3 and numLevels >= 3 then 3
         else if crossBull2 and numLevels >= 2 then 2
         else 1;

AddChartBubble(showSignals and bearSig, high, "-" + bearLvl, GlobalColor("Bear"), yes);
AddChartBubble(showSignals and bullSig, low,  "+" + bullLvl, GlobalColor("Bull"), no);

# ── DASHBOARD LABELS ──────────────────────────────────────────────────────────
def oscVal = if atrVal != 0 then (close - centerLine) / atrVal else 0;
def oscRnd = Round(oscVal, 0);

AddLabel(showDash, "Grid: " + oscVal, if oscVal >= 0 then GlobalColor("Bull") else GlobalColor("Bear"));
AddLabel(showDash and numLevels >= 1, "+1 / -1", Color.GRAY);
AddLabel(showDash and numLevels >= 2, "+2 / -2", Color.GRAY);
AddLabel(showDash and numLevels >= 3, "+3 / -3", Color.GRAY);
AddLabel(showDash and numLevels >= 4, "+4 / -4", Color.GRAY);
AddLabel(showDash and numLevels >= 5, "+5 / -5", Color.GRAY);

AddCloud(u3, u4, GlobalColor("Bull"), GlobalColor("Bull"));
AddCloud(d3, d4, GlobalColor("Bear"), GlobalColor("Bear"));
LOWER INDICATOR:
Code:
# Dynamic Grid Oscillator
# Converted from BigBeluga "Dynamic Grid Indicator [BigBeluga]"
# Conversion by Chewie 9/2/2026

declare lower;

# ── INPUTS ────────────────────────────────────────────────────────────────────
input showDash   = no;
input showSignals = no;
input hmaLength  = 150;
input atrLength  = 100;
input atrMult    = 1.6;
input numLevels  = 4;
input minGap     = 10;

# ── COLORS ────────────────────────────────────────────────────────────────────
DefineGlobalColor("Bull",  CreateColor(30, 204, 117));
DefineGlobalColor("Bear",  CreateColor(192, 64, 32));
DefineGlobalColor("OscU1", CreateColor(30, 204, 117));
DefineGlobalColor("OscU2", CreateColor(30, 204, 117));
DefineGlobalColor("OscU3", CreateColor(30, 204, 117));
DefineGlobalColor("OscU4", CreateColor(30, 204, 117));
DefineGlobalColor("OscU5", CreateColor(30, 204, 117));
DefineGlobalColor("OscD1", CreateColor(192, 64, 32));
DefineGlobalColor("OscD2", CreateColor(192, 64, 32));
DefineGlobalColor("OscD3", CreateColor(192, 64, 32));
DefineGlobalColor("OscD4", CreateColor(192, 64, 32));
DefineGlobalColor("OscD5", CreateColor(192, 64, 32));

# ── CORE ──────────────────────────────────────────────────────────────────────
def centerLine = HullMovingAvg(close, hmaLength);
def atrRaw     = WildersAverage(TrueRange(high, close, low), atrLength);
def atrVal     = atrRaw * atrMult;
def oscVal     = if atrVal != 0 then (close - centerLine) / atrVal else 0;

# ── OSCILLATOR LINE ───────────────────────────────────────────────────────────
plot OscLine = oscVal;
OscLine.AssignValueColor(if oscVal >= 0 then GlobalColor("Bull") else GlobalColor("Bear"));
OscLine.SetLineWeight(1);
OscLine.HideBubble();

# ── ZERO LINE ─────────────────────────────────────────────────────────────────
plot ZeroLine = 0;
ZeroLine.SetDefaultColor(Color.GRAY);
ZeroLine.SetLineWeight(1);
ZeroLine.HideBubble();

# ── GRADIENT FILL (cloud from oscLine to zero) ────────────────────────────────
AddCloud(OscLine, ZeroLine, GlobalColor("Bull"), GlobalColor("Bear"));

# ── OSCILLATOR GRID LINES ─────────────────────────────────────────────────────
plot OscU1 = if numLevels >= 1 then  1.0 else Double.NaN;
plot OscD1 = if numLevels >= 1 then -1.0 else Double.NaN;
OscU1.SetDefaultColor(GlobalColor("OscU1")); OscU1.SetLineWeight(1); OscU1.HideBubble();
OscD1.SetDefaultColor(GlobalColor("OscD1")); OscD1.SetLineWeight(1); OscD1.HideBubble();

plot OscU2 = if numLevels >= 2 then  2.0 else Double.NaN;
plot OscD2 = if numLevels >= 2 then -2.0 else Double.NaN;
OscU2.SetDefaultColor(GlobalColor("OscU2")); OscU2.SetLineWeight(1); OscU2.HideBubble();
OscD2.SetDefaultColor(GlobalColor("OscD2")); OscD2.SetLineWeight(1); OscD2.HideBubble();

plot OscU3 = if numLevels >= 3 then  3.0 else Double.NaN;
plot OscD3 = if numLevels >= 3 then -3.0 else Double.NaN;
OscU3.SetDefaultColor(GlobalColor("OscU3")); OscU3.SetLineWeight(1); OscU3.HideBubble();
OscD3.SetDefaultColor(GlobalColor("OscD3")); OscD3.SetLineWeight(1); OscD3.HideBubble();

plot OscU4 = if numLevels >= 4 then  4.0 else Double.NaN;
plot OscD4 = if numLevels >= 4 then -4.0 else Double.NaN;
OscU4.SetDefaultColor(GlobalColor("OscU4")); OscU4.SetLineWeight(1); OscU4.HideBubble();
OscD4.SetDefaultColor(GlobalColor("OscD4")); OscD4.SetLineWeight(1); OscD4.HideBubble();

plot OscU5 = if numLevels >= 5 then  5.0 else Double.NaN;
plot OscD5 = if numLevels >= 5 then -5.0 else Double.NaN;
OscU5.SetDefaultColor(GlobalColor("OscU5")); OscU5.SetLineWeight(1); OscU5.HideBubble();
OscD5.SetDefaultColor(GlobalColor("OscD5")); OscD5.SetLineWeight(1); OscD5.HideBubble();

# ── SIGNALS (mirrored from overlay) ──────────────────────────────────────────
def upper1 = centerLine + atrVal * 1;
def upper2 = centerLine + atrVal * 2;
def upper3 = centerLine + atrVal * 3;
def upper4 = centerLine + atrVal * 4;
def upper5 = centerLine + atrVal * 5;

def lower1 = centerLine - atrVal * 1;
def lower2 = centerLine - atrVal * 2;
def lower3 = centerLine - atrVal * 3;
def lower4 = centerLine - atrVal * 4;
def lower5 = centerLine - atrVal * 5;

def rawBear = (close crosses below upper1 and numLevels >= 1) or
              (close crosses below upper2 and numLevels >= 2) or
              (close crosses below upper3 and numLevels >= 3) or
              (close crosses below upper4 and numLevels >= 4) or
              (close crosses below upper5 and numLevels >= 5);

def rawBull = (close crosses above lower1 and numLevels >= 1) or
              (close crosses above lower2 and numLevels >= 2) or
              (close crosses above lower3 and numLevels >= 3) or
              (close crosses above lower4 and numLevels >= 4) or
              (close crosses above lower5 and numLevels >= 5);


def bearSig = rawBear and !rawBear[1] and Sum(rawBear, minGap)[1] == 0;
def bullSig = rawBull and !rawBull[1] and Sum(rawBull, minGap)[1] == 0;

def bearLvl = if close crosses below upper5 and numLevels >= 5 then -5
         else if close crosses below upper4 and numLevels >= 4 then -4
         else if close crosses below upper3 and numLevels >= 3 then -3
         else if close crosses below upper2 and numLevels >= 2 then -2
         else -1;

def bullLvl = if close crosses above lower5 and numLevels >= 5 then 5
         else if close crosses above lower4 and numLevels >= 4 then 4
         else if close crosses above lower3 and numLevels >= 3 then 3
         else if close crosses above lower2 and numLevels >= 2 then 2
         else 1;

AddChartBubble(showSignals and bearSig, oscVal, "-" + bearLvl, GlobalColor("Bear"), no);
AddChartBubble(showSignals and bullSig, oscVal, "+" + bullLvl, GlobalColor("Bull"), yes);


# ── DASHBOARD LABEL ───────────────────────────────────────────────────────────
def oscRnd = Round(oscVal, 0);
AddLabel(showDash, "Level: " + oscRnd + "  [" + oscVal + "]",
    if oscVal >= 0 then GlobalColor("Bull") else GlobalColor("Bear"));

AddCloud(OscU3, OscU4, GlobalColor("Bull"), GlobalColor("Bull"));
AddCloud(OscD3, OscD4, GlobalColor("Bear"), GlobalColor("Bear"));

