
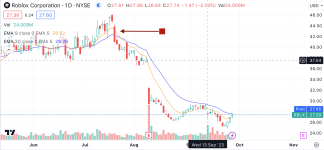
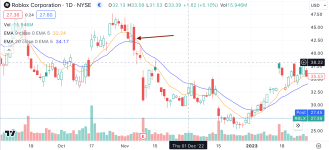
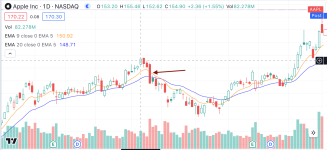
Hello, I am not familiar with code but I was hoping someone could help me with the process for writing this code. I am looking to scan the market at close for stocks that open above the 9 and 20 ema and closed below both of them. I also want the 9 ema to be higher than the 20 ema. I have attached a couple of screenshots of what I am looking for.
Drop Below 9 ema and 20 ema on the Daily Candle
- Thread starter pgoebel6
- Start date
Similar threads
-

-
-

-
 Is it possible to add a custom drop-down menu for the configuration screen to let you toggle sub-settings?
- Started by Mr_Wheeler
- Replies: 2
-
Similar threads
-
-
-
-
Is it possible to add a custom drop-down menu for the configuration screen to let you toggle sub-settings?
- Started by Mr_Wheeler
- Replies: 2
-
Similar threads
-
-
-
-
Is it possible to add a custom drop-down menu for the configuration screen to let you toggle sub-settings?
- Started by Mr_Wheeler
- Replies: 2
-
The Market Trading Game Changer
Join 2,500+ subscribers inside the useThinkScript VIP Membership Club
- Exclusive indicators
- Proven strategies & setups
- Private Discord community
- ‘Buy The Dip’ signal alerts
- Exclusive members-only content
- Add-ons and resources
- 1 full year of unlimited support
Frequently Asked Questions
What is useThinkScript?
useThinkScript is the #1 community of stock market investors using indicators and other tools to power their trading strategies. Traders of all skill levels use our forums to learn about scripting and indicators, help each other, and discover new ways to gain an edge in the markets.
How do I get started?
We get it. Our forum can be intimidating, if not overwhelming. With thousands of topics, tens of thousands of posts, our community has created an incredibly deep knowledge base for stock traders. No one can ever exhaust every resource provided on our site.
If you are new, or just looking for guidance, here are some helpful links to get you started.
- The most viewed thread:
https://usethinkscript.com/threads/repainting-trend-reversal-for-thinkorswim.183/ - Our most popular indicator:
https://usethinkscript.com/threads/buy-the-dip-indicator-for-thinkorswim.3553/ - Answers to frequently asked questions:
https://usethinkscript.com/threads/answers-to-commonly-asked-questions.6006/
What are the benefits of VIP Membership?
VIP members get exclusive access to these proven and tested premium indicators: Buy the Dip, Advanced Market Moves 2.0, Take Profit, and Volatility Trading Range. In addition, VIP members get access to over 50 VIP-only custom indicators, add-ons, and strategies, private VIP-only forums, private Discord channel to discuss trades and strategies in real-time, customer support, trade alerts, and much more. Learn all about VIP membership here.
How can I access the premium indicators?
To access the premium indicators, which are plug and play ready, sign up for VIP membership here.