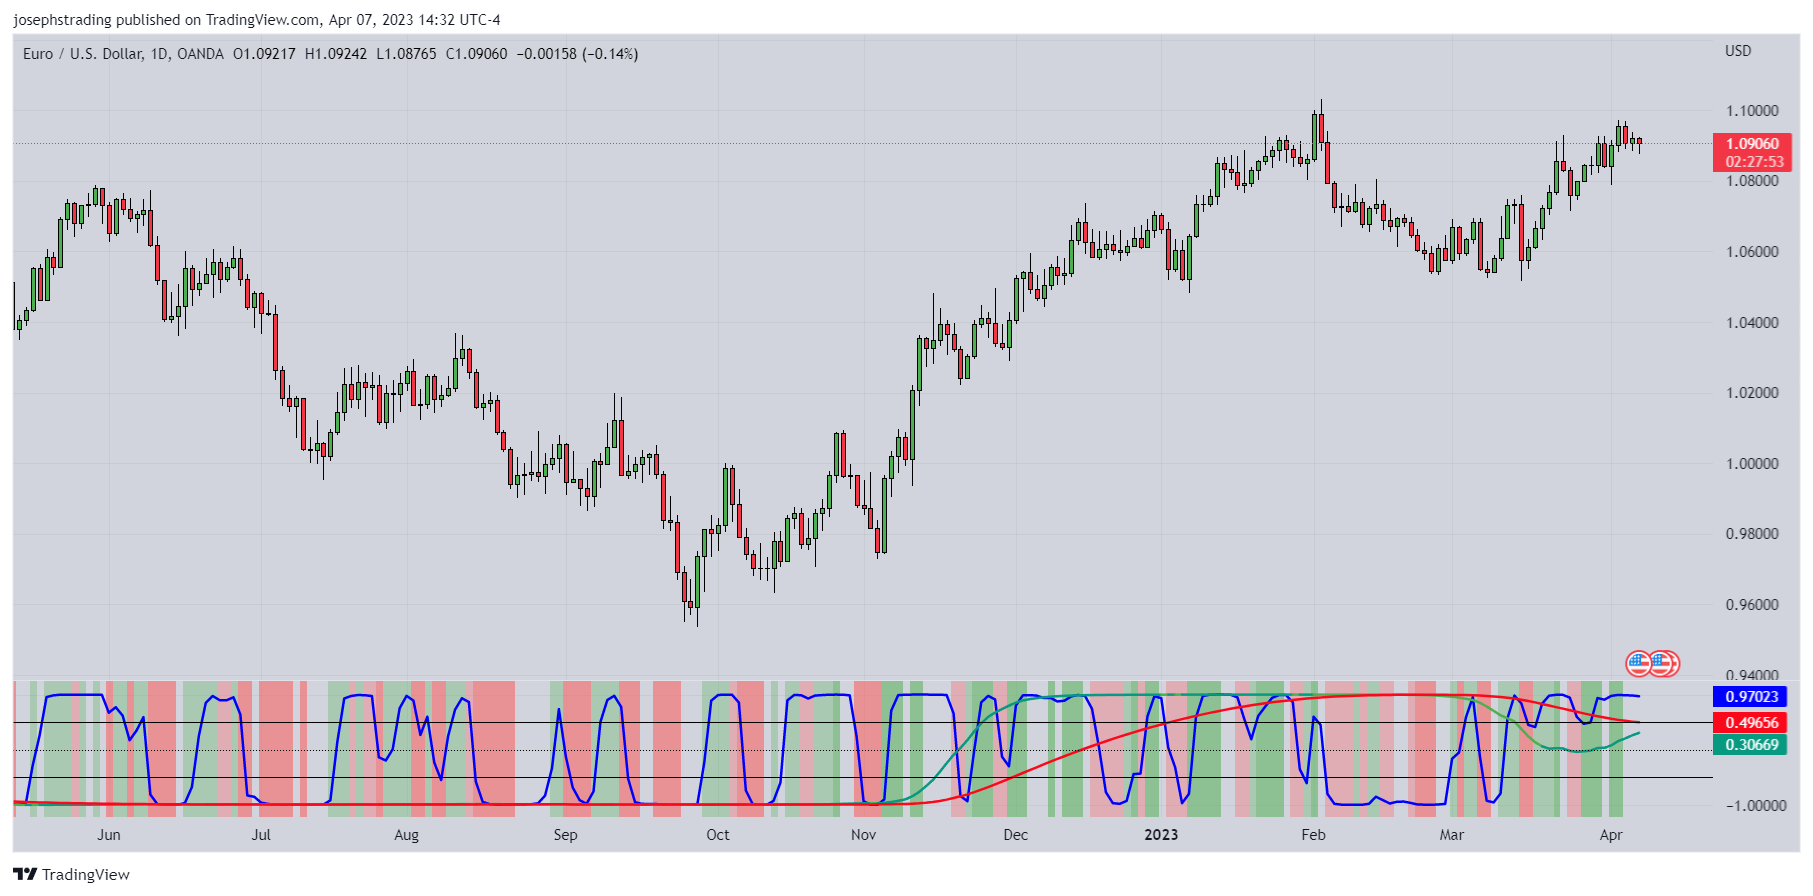
This is a pic and code for an Inverse Fisher Transform Stochastic that i was able to with help from Chat AI and a little tweaking by study to create. It uses two stochastics and two smoothing I only use two stochastics I set them at 5 and 60 and only run the smoothing for the 60 Stoch set at 60 currently. It also plots a background color of red when ever there is downward momentum and green whenever there is upward momentum. The darker colors are when both stochastics plot at same time.
This is the code for any feel free to try and code for TOS If you want
//@version=5
// author Rich Darnell
// creator John EHLERS
//
indicator('MKT SS Ver2', shorttitle='SS Ver2')
// Define the first stochastic plot
stochlength = input(5, 'STOCH Length')
wmalength = input(5, title='Smoothing length')
v1 = 0.1 * (ta.stoch(close, high, low, stochlength) - 50)
v2 = ta.wma(v1, wmalength)
INV = (math.exp(2 * v2) - 1) / (math.exp(2 * v2) + 1)
// Determine the direction of the first stochastic plot
dir = v1 > v2 ? 1 : v1 < v2 ? -1 : 0
// Define the colors for the first stochastic plot
c1 = dir == 1 ? color.green : dir == -1 ? color.red : color.blue
// Plot the first stochastic plot and its smoothing line
plot(INV, color=c1, linewidth=2)
plot(ta.wma(INV, wmalength), color=dir == 1 ? color.green : color.red, linewidth=1)
// Define parameters for the second stochastic plot
stochlength2 = input(30, 'STOCH Length 2')
wmalength2 = input(30, title='Smoothing length 2')
v3 = 0.1 * (ta.stoch(close, high, low, stochlength2) - 50)
v4 = ta.wma(v3, wmalength2)
INV2 = (math.exp(2 * v4) - 1) / (math.exp(2 * v4) + 1)
// Determine the direction of the second stochastic plot
dir2 = v3 > v4 ? 1 : v3 < v4 ? -1 : 0
// Define the colors for the second stochastic plot
c2 = dir2 == 1 ? color.green : dir2 == -1 ? color.red : color.blue
// Plot the second stochastic plot and its smoothing line
plot(INV2, color=c2, linewidth=2)
plot(ta.wma(INV2, wmalength2), color=dir2 == 1 ? color.green : color.red, linewidth=1)
// Plot the background color for the trigger bar V1
bgcolor(dir > 0 and v1 > 0.5 ? color.green : dir < 0 and v1 < -0.5 ? color.red : na, transp=80)
// Plot the background color for the trigger bar V3
bgcolor(dir > 0 and v3 > 0.5 ? color.green : dir < 0 and v3 < -0.5 ? color.red : na, transp=80)
hline(0, color=color.gray)
hline(0.5, color=color.red)
hline(-0.5, color=color.green)