
Boring Stuff:
This is just an adaptation of the Donchian Trend Ribbon as a watchlist column. Since it is a variation I gave it its own thread (otherwise feel free to move). The significant change is that we are only using the absolute value of the sum of alt trends to give us a column.
In Simple Terms:
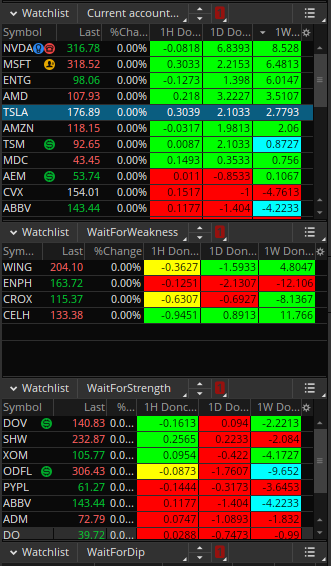
This watchlist column is an excellent way of telling what the trend is at a glance of your watchlists.
How I Use It:
I am a Buy the Dip Buyer, but I dont buy a stock just because it dips. I research it, and if I like a company I put it on a watchlist and wait for strength to return before I buy. This watchlist confirms the rebound. I am playing with this on the 1 hour charts right now.
Whats the numbers on the column?
To help me see where we are in the trend (or how significant the current move is) I placed numbers on the watchlist column that show the difference between the 3 period sma and the 5 period sma. The logic is, the bigger the current move the bigger the difference between the two numbers.
Illustration:
The Code:
This is just an adaptation of the Donchian Trend Ribbon as a watchlist column. Since it is a variation I gave it its own thread (otherwise feel free to move). The significant change is that we are only using the absolute value of the sum of alt trends to give us a column.
In Simple Terms:
This watchlist column is an excellent way of telling what the trend is at a glance of your watchlists.
How I Use It:
I am a Buy the Dip Buyer, but I dont buy a stock just because it dips. I research it, and if I like a company I put it on a watchlist and wait for strength to return before I buy. This watchlist confirms the rebound. I am playing with this on the 1 hour charts right now.
Whats the numbers on the column?
To help me see where we are in the trend (or how significant the current move is) I placed numbers on the watchlist column that show the difference between the 3 period sma and the 5 period sma. The logic is, the bigger the current move the bigger the difference between the two numbers.
Illustration:
The Code:
Code:
# Define the SMAs
def sma1 = Average(close, 3);
def sma2 = Average(close, 5);
# Plot the difference between the SMAs
def diff = sma1 - sma2;


# Define your inputs
input Donchian_Channel_Period = 20;
def dlen = if Donchian_Channel_Period < 10 then 10 else Donchian_Channel_Period;

# Define your scripts here as in your original script
script dchannel {
  input len = 0;
  def hh = highest(high, len);
  def ll = lowest(low, len);
  def trend = if barnumber() == 1 then 0 else if close > hh[1] then 1 else if close < ll[1] then -1 else trend[1];
  plot z = trend;
}

script dchannelalt {
  input len = 0;
  input maintrend = 0;
  def hh = highest(high, len);
  def ll = lowest(low, len);
  def trend = if barnumber() == 1 then 0 else if close > hh[1] then 1 else if close < ll[1] then -1 else trend[1];

 def maincolor =
  if maintrend == 1 then if trend == 1 then 2 else 1
  else if maintrend == -1 then if trend == -1 then -2 else -1
  else 0;

  plot color = maincolor;
}

def maintrend = dchannel(dlen);

def c01 = dchannelalt(dlen - 0, maintrend);


def c02 = dchannelalt(dlen - 1, maintrend);


def c03 = dchannelalt(dlen - 2, maintrend);


def c04 = dchannelalt(dlen - 3, maintrend);


def c05 = dchannelalt(dlen - 4, maintrend);


def c06 = dchannelalt(dlen - 5, maintrend);


def c07 = dchannelalt(dlen - 6, maintrend);


def c08 = dchannelalt(dlen - 7, maintrend);


def c09 = dchannelalt(dlen - 8, maintrend);


def c10 = dchannelalt(dlen - 9, maintrend);


# -----------------------------

# add up color numbers, to come up with a 'trend' number , 20 to -20
def colorsum = ( c01 + c02 + c03 + c04 + c05 + c06 + c07 + c08 + c09 + c10 );

# Calculate the value of zc and assign it a color
def zc = absvalue(colorsum);
AssignBackgroundColor( if colorsum == (2*10) then color.green
else if colorsum > 0 then color.cyan
else if colorsum == (-2*10) then color.red
 else if colorsum < 0 then color.yellow
 else color.gray);

# Return the value of zc
AddLabel(yes, diff, color.black);
Last edited: