I need help!
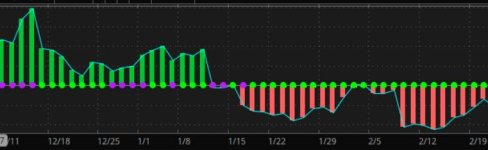
I want to scale the DMI and Squeeze into the same chart, similar to when @netrachitech scales the ergodic and squeeze together:
https://usethinkscript.com/threads/ergodic-oscillator-for-thinkorswim.12511/#post-107223
I tried to do the same with DMI and have one problem ( the SQUEEZE input Length is red?) Could someone help me?
declare lower;
script normalizer {
input data = close;
input Min = -1;
input Max = 1;
input length = 50;
def hhData = Highest(data, length);
def llData = Lowest(data, length);
plot resized = (((Max - Min) * (data - llData)) /
(hhData - llData)) + Min;
}
### DMI OSCILLATOR ###
declare lower;
input length = 10;
input paintBars = yes;
input averageType = AverageType.WILDERS;
def diPlus = DMI(length, averageType)."DI+";
def diMinus = DMI(length, averageType)."DI-";
plot Osc = diPlus - diMinus;
plot Hist = Osc;
plot ZeroLine = 0;
Osc.SetDefaultColor(GetColor(1));
Hist.SetPaintingStrategy(PaintingStrategy.HISTOGRAM);
Hist.SetLineWeight(3);
Hist.DefineColor("Positive", Color.UPTICK);
Hist.DefineColor("Negative", Color.DOWNTICK);
Hist.AssignValueColor(if Hist > 0 then Hist.Color("Positive") else Hist.Color("Negative"));
Hist.HideTitle();
ZeroLine.SetDefaultColor(Color.GRAY);
DefineGlobalColor("Positive", Color.UPTICK);
DefineGlobalColor("Negative", Color.DOWNTICK);
AssignPriceColor(if !paintBars
then Color.CURRENT
else if Osc > 0
then GlobalColor("Positive")
else GlobalColor("Negative"));
### SQUEEZE ###
input length = 21; #hint length: Length for average calculation.
input price = close;
input SDmult = 2.0;
input ATRmult = 1.5;
def K = (Highest(high, length) + Lowest(low, length)) / 2 + ExpAverage(close, length);
plot Momo = normalizer(Inertia(price - K / 2, length));
Momo.SetPaintingStrategy(PaintingStrategy.HISTOGRAM);
Momo.SetLineWeight(5);
Momo.AssignValueColor(if Momo > Momo[1] and Momo > 0 then Color.CYAN
else if Momo > 0 and Momo < Momo[1] then Color.BLUE
else if Momo < 0 and Momo < Momo[1] then Color.RED
else Color.YELLOW);
#--------------- [ Metrics From Mobius ] ---------------
def SD = StDev(close, length);
def Avg = Average(close, length);
def ATR = Average(TrueRange(high, close, low), length);
def SDup = normalizer(Avg + (SDmult * SD));
def ATRup = normalizer(Avg + (ATRmult * ATR));
plot Squeeze = if SDup < ATRUp then 0 else Double.NaN;
#------------------------------------------------------------------------------------------
# David M.(Some Random Alien) 10-6-2021
# Don't blame Mobius... I made this mess")
# Code displays Squeeze Watch Prediction Index.
# Depending on volume, a score of less then 25 could signal an impeding Squeeze.
def squeezePrediction = ((SDup - ATRup) / (SDup + ATRup) / 2) * 100;
def squeezeIndex = Round(squeezePrediction * 10000, 0);
def squeezeIndexDifference = (squeezeIndex - squeezeIndex[1]) / (squeezeIndex + squeezeIndex[1]) / 2 * 100;
def squeezeProgress = Round((squeezePrediction - squeezePrediction[1]) * 10000, 2);
def squeezeIndexOn = squeezeIndex <= 0;
rec counter = if squeezeIndexOn then counter[1] + 1 else 0;
def deepSqueeze = squeezeIndex <= -20;
rec accumCounter = if squeezeIndex >= 0 then accumCounter[1] + 1 else 0;
rec historicalDifference = if squeezeIndexOn then Lowest(squeezeIndexDifference) else historicalDifference[1];
#---------------------------- [ Plots Some Dots ] -----------------------------
Squeeze.SetPaintingStrategy(PaintingStrategy.POINTS);
Squeeze.SetLineWeight(5);
Squeeze.AssignValueColor( if deepSqueeze then CreateColor(185, 30, 249) else color.RED);
Squeeze.SetDefaultColor(Color.RED);
#------------------------------------------------------------------------------
# Make the SI bar look pretty
#AddLabel(yes, " SQUEEZE INDEX: " + squeezeIndex + " [" + squeezeIndex[1] + "] " + "[" + AsText(squeezeIndexDifference, NumberFormat.TWO_DECIMAL_PLACES) + "%] " + "[" + (counter[1]) + "] | " + "[" + accumCounter + "] " + "[" + AsText(historicalDifference[1], NumberFormat.TWO_DECIMAL_PLACES) + "%] ", if squeezeIndex > squeezeIndex[1] and squeezeIndex > 50 and squeezeIndexDifference > 0 then CreateColor(16, 198, 226) else color.LIGHT_ORANGE);
def fixBug = if squeezeIndex >= 0 then counter[1] == counter[1] == 0 else Double.NaN;
#--------------------------------------------------------------------------------------------------
#---------------------------------------------------------------------------------------------------
#
# I changed this Mobius code to show orange during initial squeeze
# and then turns to red if >5 squeeze bars. John Carter believes that a squeeze of 5 is better
# than a squeeze of 2 or 3. He is correct. However, during my initial testing, a squeeze of more
# than 5 is not better. During my testing, a squeeze substantially greater than 20 is worse than a 5.
# Your mileage may vary. Consult your owner's manual for more information. Hands and feet inside the ride
# at all times And because I am a self-taught coder, I messed up Mobius' pretty formatting to reflect
# my ignorance of the craft
#
#----------------------------------------------------------------------------------------------------
#AddLabel(!IsNaN(Squeeze), " >>> Squeeze <<< ", if IsAscending(Momo)
#then Color.GREEN else if counter[1] >= 5 then Color.RED else CreateColor(16, 198, 226));
def cleanup = if IsNaN(Squeeze) then counter[1] == 0 else 0;
plot zero = if IsNaN(close) or !IsNaN(Squeeze) then Double.NaN else 0;
zero.SetPaintingStrategy(PaintingStrategy.POINTS);
zero.SetLineWeight(5);
zero.SetDefaultColor(Color.GREEN);
I want to scale the DMI and Squeeze into the same chart, similar to when @netrachitech scales the ergodic and squeeze together:
https://usethinkscript.com/threads/ergodic-oscillator-for-thinkorswim.12511/#post-107223
I tried to do the same with DMI and have one problem ( the SQUEEZE input Length is red?) Could someone help me?
declare lower;
script normalizer {
input data = close;
input Min = -1;
input Max = 1;
input length = 50;
def hhData = Highest(data, length);
def llData = Lowest(data, length);
plot resized = (((Max - Min) * (data - llData)) /
(hhData - llData)) + Min;
}
### DMI OSCILLATOR ###
declare lower;
input length = 10;
input paintBars = yes;
input averageType = AverageType.WILDERS;
def diPlus = DMI(length, averageType)."DI+";
def diMinus = DMI(length, averageType)."DI-";
plot Osc = diPlus - diMinus;
plot Hist = Osc;
plot ZeroLine = 0;
Osc.SetDefaultColor(GetColor(1));
Hist.SetPaintingStrategy(PaintingStrategy.HISTOGRAM);
Hist.SetLineWeight(3);
Hist.DefineColor("Positive", Color.UPTICK);
Hist.DefineColor("Negative", Color.DOWNTICK);
Hist.AssignValueColor(if Hist > 0 then Hist.Color("Positive") else Hist.Color("Negative"));
Hist.HideTitle();
ZeroLine.SetDefaultColor(Color.GRAY);
DefineGlobalColor("Positive", Color.UPTICK);
DefineGlobalColor("Negative", Color.DOWNTICK);
AssignPriceColor(if !paintBars
then Color.CURRENT
else if Osc > 0
then GlobalColor("Positive")
else GlobalColor("Negative"));
### SQUEEZE ###
input length = 21; #hint length: Length for average calculation.
input price = close;
input SDmult = 2.0;
input ATRmult = 1.5;
def K = (Highest(high, length) + Lowest(low, length)) / 2 + ExpAverage(close, length);
plot Momo = normalizer(Inertia(price - K / 2, length));
Momo.SetPaintingStrategy(PaintingStrategy.HISTOGRAM);
Momo.SetLineWeight(5);
Momo.AssignValueColor(if Momo > Momo[1] and Momo > 0 then Color.CYAN
else if Momo > 0 and Momo < Momo[1] then Color.BLUE
else if Momo < 0 and Momo < Momo[1] then Color.RED
else Color.YELLOW);
#--------------- [ Metrics From Mobius ] ---------------
def SD = StDev(close, length);
def Avg = Average(close, length);
def ATR = Average(TrueRange(high, close, low), length);
def SDup = normalizer(Avg + (SDmult * SD));
def ATRup = normalizer(Avg + (ATRmult * ATR));
plot Squeeze = if SDup < ATRUp then 0 else Double.NaN;
#------------------------------------------------------------------------------------------
# David M.(Some Random Alien) 10-6-2021
# Don't blame Mobius... I made this mess
# Code displays Squeeze Watch Prediction Index.
# Depending on volume, a score of less then 25 could signal an impeding Squeeze.
def squeezePrediction = ((SDup - ATRup) / (SDup + ATRup) / 2) * 100;
def squeezeIndex = Round(squeezePrediction * 10000, 0);
def squeezeIndexDifference = (squeezeIndex - squeezeIndex[1]) / (squeezeIndex + squeezeIndex[1]) / 2 * 100;
def squeezeProgress = Round((squeezePrediction - squeezePrediction[1]) * 10000, 2);
def squeezeIndexOn = squeezeIndex <= 0;
rec counter = if squeezeIndexOn then counter[1] + 1 else 0;
def deepSqueeze = squeezeIndex <= -20;
rec accumCounter = if squeezeIndex >= 0 then accumCounter[1] + 1 else 0;
rec historicalDifference = if squeezeIndexOn then Lowest(squeezeIndexDifference) else historicalDifference[1];
#---------------------------- [ Plots Some Dots ] -----------------------------
Squeeze.SetPaintingStrategy(PaintingStrategy.POINTS);
Squeeze.SetLineWeight(5);
Squeeze.AssignValueColor( if deepSqueeze then CreateColor(185, 30, 249) else color.RED);
Squeeze.SetDefaultColor(Color.RED);
#------------------------------------------------------------------------------
# Make the SI bar look pretty
#AddLabel(yes, " SQUEEZE INDEX: " + squeezeIndex + " [" + squeezeIndex[1] + "] " + "[" + AsText(squeezeIndexDifference, NumberFormat.TWO_DECIMAL_PLACES) + "%] " + "[" + (counter[1]) + "] | " + "[" + accumCounter + "] " + "[" + AsText(historicalDifference[1], NumberFormat.TWO_DECIMAL_PLACES) + "%] ", if squeezeIndex > squeezeIndex[1] and squeezeIndex > 50 and squeezeIndexDifference > 0 then CreateColor(16, 198, 226) else color.LIGHT_ORANGE);
def fixBug = if squeezeIndex >= 0 then counter[1] == counter[1] == 0 else Double.NaN;
#--------------------------------------------------------------------------------------------------
#---------------------------------------------------------------------------------------------------
#
# I changed this Mobius code to show orange during initial squeeze
# and then turns to red if >5 squeeze bars. John Carter believes that a squeeze of 5 is better
# than a squeeze of 2 or 3. He is correct. However, during my initial testing, a squeeze of more
# than 5 is not better. During my testing, a squeeze substantially greater than 20 is worse than a 5.
# Your mileage may vary. Consult your owner's manual for more information. Hands and feet inside the ride
# at all times
And because I am a self-taught coder, I messed up Mobius' pretty formatting to reflect# my ignorance of the craft
#
#----------------------------------------------------------------------------------------------------
#AddLabel(!IsNaN(Squeeze), " >>> Squeeze <<< ", if IsAscending(Momo)
#then Color.GREEN else if counter[1] >= 5 then Color.RED else CreateColor(16, 198, 226));
def cleanup = if IsNaN(Squeeze) then counter[1] == 0 else 0;
plot zero = if IsNaN(close) or !IsNaN(Squeeze) then Double.NaN else 0;
zero.SetPaintingStrategy(PaintingStrategy.POINTS);
zero.SetLineWeight(5);
zero.SetDefaultColor(Color.GREEN);
Last edited by a moderator: