Distance/Range from two MA's Help

METAL

Well-known member
Plus
@Svanoy , You helped me with a similar request. (https://usethinkscript.com/threads/pullback-after-ema-crossover.16891/#post-132591) however, I am trying to create a watchlist or scan that will let me know which stocks have the 20 EMA and the 200 EMA at a close proximity. I have been having a great trading success when I find a stock where the 20 and 200 EMA's are pretty close and if price moves above or below them is the entry.
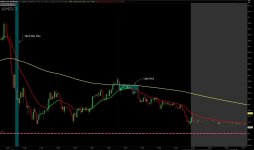
If any other coders would like to help, I would greatly appreciate it. The distance in the TSLA example is around .50.
1703722354401.png


1703721278782.png
 
I got it. Getting a little better 😛. If anyone else uses the Oliver Valez trading strategy, You may want to use this for the better entries.

Code:
# Distance between 20 EMA and 200 EMA indicator with background coloring
input fastLength = 20;
input slowLength = 200;
input distanceThreshold = 00.60;  # Adjust this value as needed

def fastEMA = ExpAverage(close, fastLength);
def slowEMA = ExpAverage(close, slowLength);

def emaDistance = AbsValue(fastEMA - slowEMA);

# Color the background based on the distance between EMAs
AssignBackgroundColor(if emaDistance <= distanceThreshold then Color.CYAN else Color.BLACK);

# Plot the EMAs on the chart
plot FastEMAValue = fastEMA;
plot SlowEMAValue = slowEMA;

# Add labels for better visualization
#AddLabel(yes, "Fast EMA: " + Round(fastEMA, 2), Color.CYAN);
#AddLabel(yes, "Slow EMA: " + Round(slowEMA, 2), Color.yellow);
AddLabel(yes, "EMA Distance: " + Round(emaDistance, 2), Color.GRAY);
 

Join useThinkScript to post your question to a community of 21,000+ developers and traders.

Can someone please help me with adding a Cyan cloud on chart when the two ma's get within specified range. I have the range/distance set to .60 but is can be adjusted. Thanks in advance. @halcyonguy @Svanoy @SleepyZ @samer800 @BenTen

Code:
# Distance between 20 EMA and 200 EMA indicator with background coloring
input fastLength = 20;
input slowLength = 200;
input distanceThreshold = 0.60;  # Adjust this value as needed
input showBackgroundColor = yes;  # Input to turn on/off background color

def fastEMA = ExpAverage(close, fastLength);
def slowEMA = ExpAverage(close, slowLength);

def emaDistance = AbsValue(fastEMA - slowEMA);

# Color the background based on the distance between EMAs
AssignBackgroundColor(if showBackgroundColor and emaDistance <= distanceThreshold then Color.CYAN else Color.BLACK);

# Plot the EMAs on the chart
plot FastEMAValue = fastEMA;
plot SlowEMAValue = slowEMA;

# Add labels for better visualization
#AddLabel(yes, "Fast EMA: " + Round(fastEMA, 2), Color.CYAN);
#AddLabel(yes, "Slow EMA: " + Round(slowEMA, 2), Color.yellow);
AddLabel(yes, "EMA Distance: " + Round(emaDistance, 2), Color.GRAY);
 
Ruby:
AddCloud(if emaDistance <= distanceThreshold then Double.POSITIVE_INFINITY else Double.NaN, if emaDistance <= distanceThreshold then Double.NEGATIVE_INFINITY else Double.NaN, color.CYAN, color.BLACK, yes);
 
@Svanoy Thank you. Is there a way to make the cloud only stay between the two lines. Sorry if I didn't make that clear. See example:
1703944941642.jpeg
 

Attachments

  • 1703944934422.jpeg
    1703944934422.jpeg
    129.7 KB · Views: 73
Well once again a blind squirrel can find a nut.
Not sure why it colors red as I did not add that but I may like that better. For anyone that my want it, here it is.
Code:
# Distance between 20 EMA and 200 EMA indicator with background coloring
input fastLength = 20;
input slowLength = 200;
input distanceThreshold = 0.10;  # Adjust this value as needed
input showBackgroundColor = yes;  # Input to turn on/off background color
input showcloud = yes; 


def fastEMA = ExpAverage(close, fastLength);
def slowEMA = ExpAverage(close, slowLength);

def emaDistance = AbsValue(fastEMA - slowEMA);

# Color the background based on the distance between EMAs
AssignBackgroundColor(if showBackgroundColor and emaDistance <= distanceThreshold then Color.CYAN else Color.BLACK);

# Plot the EMAs on the chart
plot FastEMAValue = fastEMA;
plot SlowEMAValue = slowEMA;

# Add labels for better visualization
#AddLabel(yes, "Fast EMA: " + Round(fastEMA, 2), Color.CYAN);
#AddLabel(yes, "Slow EMA: " + Round(slowEMA, 2), Color.yellow);
AddLabel(yes, "EMA Distance: " + Round(emaDistance, 2), Color.GRAY);


# Add Cloud based on the distance between EMAs
AddCloud(if showcloud and emaDistance <= distanceThreshold then fastEMA else Double.NaN,
         if showcloud and emaDistance <= distanceThreshold then slowEMA else Double.NaN, Color.CYAN);

Here is QQQ on the 29th. The only thin I wished was possible is to have automatic adjustment based on individual stocks. If that is possible, Can someone point me in the right direction. You will need to adjust the range per stock as the range distances will vary.

This works great at giving us a heads up for a possible big move. It works great by itself but there may be other indicators that will help to confirm an incoming move. These are also appreciated.

I also want to add the "opposite" so that when the two ma's are way apart and price goes above the 20 ema I get another signal/alert.

1703959491991.png
 

Similar threads

Not the exact question you're looking for?

Start a new thread and receive assistance from our community.

87k+ Posts
374 Online
Create Post

Similar threads

Similar threads

The Market Trading Game Changer

Join 2,500+ subscribers inside the useThinkScript VIP Membership Club
  • Exclusive indicators
  • Proven strategies & setups
  • Private Discord community
  • ‘Buy The Dip’ signal alerts
  • Exclusive members-only content
  • Add-ons and resources
  • 1 full year of unlimited support

Frequently Asked Questions

What is useThinkScript?

useThinkScript is the #1 community of stock market investors using indicators and other tools to power their trading strategies. Traders of all skill levels use our forums to learn about scripting and indicators, help each other, and discover new ways to gain an edge in the markets.

How do I get started?

We get it. Our forum can be intimidating, if not overwhelming. With thousands of topics, tens of thousands of posts, our community has created an incredibly deep knowledge base for stock traders. No one can ever exhaust every resource provided on our site.

If you are new, or just looking for guidance, here are some helpful links to get you started.

What are the benefits of VIP Membership?
VIP members get exclusive access to these proven and tested premium indicators: Buy the Dip, Advanced Market Moves 2.0, Take Profit, and Volatility Trading Range. In addition, VIP members get access to over 50 VIP-only custom indicators, add-ons, and strategies, private VIP-only forums, private Discord channel to discuss trades and strategies in real-time, customer support, trade alerts, and much more. Learn all about VIP membership here.
How can I access the premium indicators?
To access the premium indicators, which are plug and play ready, sign up for VIP membership here.
Back
Top