songvicobac
New member
Does anyone know how to display let say yesterday close ,draw a line and bubble say yesterday high on the right edge?
Thanks
Thanks
Join useThinkScript to post your question to a community of 21,000+ developers and traders.
Hi, is it possible to move chart bubbles to the left or right, or up or down to avoid obscuring the immediate candle action? Looking at stuff people are showing, these bubbles are quite large. Txs in advance.https://tlc.thinkorswim.com/center/reference/thinkScript/Functions/Look---Feel/AddChartBubbleThe first parameter will dictate if the chartbubble is visible.
Code:plot hvol = volume; hvol.SetPaintingStrategy(PaintingStrategy.HISTOGRAM); hvol.SetLineWeight(3); AddChartBubble(hvol > 1500000, 0, hvol , color.green, no);
Here are 3 options for displaying volume data from your code.Hi, is it possible to move chart bubbles to the left or right, or up or down to avoid obscuring the immediate candle action? Looking at stuff people are showing, these bubbles are quite large. Txs in advance.
 Python:
plot hvol = volume;
hvol.SetPaintingStrategy(PaintingStrategy.HISTOGRAM);
hvol.SetLineWeight(3);

input bubblemover_sideways = 0;
input bubblemover_updown   = 1000000;
def b = bubblemover_sideways;
def b1 = b + 1;
AddChartBubble(hvol[b] > 1500000, hvol[b] + bubblemover_updown, Round(hvol[b] / 1000000, 1) , Color.GREEN, yes);
AddVerticalLine(hvol[b] > 1500000, "                             " + hvol[b] , Color.GREEN, yes);

input bubblemover_sideways1 = -1;
input bubblemover_updown1   = 1000000;
def z = bubblemover_sideways1;
def z1 = z + 1;
AddChartBubble(IsNaN(hvol[z]) and !IsNaN(hvol[z1]), hvol[z1] + bubblemover_updown1, volume[z1], Color.GREEN, yes);
Priceline has been very helpful with my trades and planning S/R entry and exit. Sharing maybe you may have a use of it too. Good luck! @cabe1332Needing your assistance in adding a price bubble to the right extension (screenshot below, red square) to the Priceline level current script below. The Priceline is colored magenta. It's Friday and have a beta brain blocked. Your assis t is much appreciated. @cabe1332
Code:# Priceline level # Plots a Horizontal Line that follows the price/close value # cabe1332 # start code input price=close; input offset=0; input length = 100; def sma = SimpleMovingAvg(price, 1, length); rec line = if IsNaN(sma) then line[1] else sma[offset]; plot priceline=if isnan(sma) then line else double.nan; priceline.setpaintingStrategy(paintingStrategy.LINE); priceline.setlineWeight(3); priceline.setdefaultColor(color.magenta); priceline.hideBubble(); # end code
Thank you!@crazyturtle Moved your post to this thread as there are several examples for moving to the right edge.
Your previous thread also had examples:
https://usethinkscript.com/threads/relocate-addchartbubble-to-outside-of-chart.1424/
In this and other scripts it is often helpful to turn off / on bubbles. Is there a single input line snippet we can add to any script that allows us to turn them all off or on without having to go to each portion of code or the settings for each?
Ruby:#Addchartbubble_Display High @candle to left of Conditional Candle Displaying High of Candle to Left input show_any_bubble = yes; plot ma1 = Average(close, 2); plot ma2 = Average(close, 5); def cond = ma1 crosses above ma2; #Bubble placed where cond happened displaying the cond high input show_cond_bubble = yes; AddChartBubble(show_any_bubble and show_cond_bubble and cond, high, high, Color.MAGENTA); #Bubble placed @High of Previous Candle to the Conditional Cancle input show_previous_candle_bubble = yes; AddChartBubble(show_any_bubble and show_previous_candle_bubble and cond[-1], high[0], high[0], Color.WHITE);
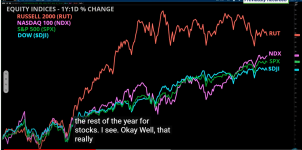
@GOAT Your image isn't native to ToS. All those titles and labels were photoshopped.I would like to set up my line charts so the symbol is on the chart at the end of the line, as opposed to above in the heading , as it's can be difficult to identify the symbols with multiple comparisons. I copied this image from a TOS review show, which shows what it looks like, but I have been unable to find any instructions on how to set it up. Can someone help?
Thanks
I would like to set up my line charts so the symbol is on the chart at the end of the line, as opposed to above in the heading , as it's can be difficult to identify the symbols with multiple comparisons. I copied this image from a TOS review show, which shows what it looks like, but I have been unable to find any instructions on how to set it up. Can someone help?
Thanks
12186[/ATTACH]']
 Ruby:
Ruby:#Comparative Sector Performance #Fox Technicals #12-12-17 #Summary: Compares sector performance on the day by % declare hide_on_daily; declare lower; input Agg = AggregationPeriod.DAY; def RTH = if SecondsFromTime(0930) > 0 and SecondsTillTime(1600) >= 0 then 1 else double.nan; plot ZeroLine = 0; #Sector 1 input symbol_a = "XLE"; def percA = Round(((close(symbol_a) - close(symbol_a, agg)[1]) / close(symbol_a, agg)[1]) * 100, 2); plot Sect1 = if RTH and !RTH[1] then PercA else PercA; Sect1.SetDefaultColor(GetColor(1)); Sect1.SetPaintingStrategy(PaintingStrategy.LINE_VS_POINTS); AddChartBubble(IsNaN(close[-1]) and !IsNAN(close), Sect1, symbol_a + ": " + Sect1 + "% ", Sect1.TakeValueColor(), if Sect1 < 0 then 0 else 1); #Sector 2 input symbol_b = "XLF"; def percB = Round(((close(symbol_b) - close(symbol_b, agg)[1]) / close(symbol_b, agg)[1]) * 100, 2); plot Sect2 = if RTH and !RTH[1] then PercB else PercB; Sect2.SetDefaultColor(GetColor(2)); Sect2.SetPaintingStrategy(PaintingStrategy.LINE_VS_POINTS); AddChartBubble(IsNaN(close[-1]) and !IsNAN(close), Sect2, symbol_b + ": " + Sect2 + "% ", Sect2.TakeValueColor(), if Sect2 < 0 then 0 else 1); #Sector 3 input symbol_c = "XLI"; def percC = Round(((close(symbol_c) - close(symbol_c, agg)[1]) / close(symbol_c, agg)[1]) * 100, 2); plot Sect3 = if RTH and !RTH[1] then PercC else PercC; Sect3.SetDefaultColor(GetColor(3)); Sect3.SetPaintingStrategy(PaintingStrategy.LINE_VS_POINTS); AddChartBubble(IsNaN(close[-1]) and !IsNAN(close), Sect3, symbol_c + ": " + Sect3 + "% ", Sect3.TakeValueColor(), if Sect3 < 0 then 0 else 1); #Sector 4 input symbol_d = "XLK"; def percD = Round(((close(symbol_d) - close(symbol_d, agg)[1]) / close(symbol_d, agg)[1]) * 100, 2); plot Sect4 = if RTH and !RTH[1] then PercD else PercD; Sect4.SetDefaultColor(GetColor(4)); Sect4.SetPaintingStrategy(PaintingStrategy.LINE_VS_POINTS); AddChartBubble(IsNaN(close[-1]) and !IsNAN(close), Sect4, symbol_d + ": " + Sect4 + "% ", Sect4.TakeValueColor(), if sect4 < 0 then 0 else 1); #Sector 5 input symbol_e = "XLP"; def percE = Round(((close(symbol_e) - close(symbol_e, agg)[1]) / close(symbol_e, agg)[1]) * 100, 2); plot Sect5 = if RTH and !RTH[1] then PercE else PercE; Sect5.SetDefaultColor(GetColor(5)); Sect5.SetPaintingStrategy(PaintingStrategy.LINE_VS_POINTS); AddChartBubble(IsNaN(close[-1]) and !IsNAN(close), Sect5, symbol_e + ": " + Sect5 + "% ", Sect5.TakeValueColor(), if Sect5 < 0 then 0 else 1); #Sector 6 input symbol_f = "XLU"; def percF = Round(((close(symbol_f) - close(symbol_f, agg)[1]) / close(symbol_f, agg)[1]) * 100, 2); plot Sect6 = if RTH and !RTH[1] then PercF else PercF; Sect6.SetDefaultColor(GetColor(5)); Sect6.SetPaintingStrategy(PaintingStrategy.LINE_VS_POINTS); AddChartBubble(IsNaN(close[-1]) and !IsNAN(close), Sect6, symbol_f + ": " + Sect6 + "% ", Sect6.TakeValueColor(), if Sect6 < 0 then 0 else 1); #Sector 7 input symbol_g = "XLV"; def percG = Round(((close(symbol_g) - close(symbol_g, agg)[1]) / close(symbol_g, agg)[1]) * 100, 2); plot Sect7 = if RTH and !RTH[1] then PercG else PercG; Sect7.SetDefaultColor(GetColor(5)); Sect7.SetPaintingStrategy(PaintingStrategy.LINE_VS_POINTS); AddChartBubble(IsNaN(close[-1]) and !IsNAN(close), Sect7, symbol_g + ": " + Sect7 + "% ", Sect7.TakeValueColor(), if Sect7 < 0 then 0 else 1);
not sure what you are trying to do, your words say 2 different things, and the code is different from both.
the limit formula is identifying the last bar.
do you want bubbles to be displayed to the right of the last bar? ( off to the right)
---------------
EDIT 22-09-26
fix my code, it was 1 bar off
add an image
change the bubble to describe what is happening
------------------
here is a code to place a bubble x bars after the last bar
Ruby:# plots a bubble, x bars after last bar, # at a price level equal to the last bar close input bars_in_future = 3; def bif = bars_in_future; def x = !IsNaN(close[bif]) and IsNaN(close[bif - 1]); def vert = close[bif]; input show_bubble = yes; AddChartBubble(show_bubble and x, vert, "Draw a bubble\n" + bif + " bars\n" + "after the last bar,\n" + "at a price equal to the\n" + "last bar close\n" + vert , Color.WHITE, yes); #

input plotLabelOffset = 5;
input showTodayOpen = yes;
input showOnlyLastPeriod = yes;
input showPlotLabels = yes;


def labelLocBar = !IsNaN(close) and IsNaN(close[-1]);
def aggregationPeriod = AggregationPeriod.DAY;
def displace0 = 0;

plot Open;
if !showTodayOpen or (showOnlyLastPeriod and !IsNaN(open(period = aggregationPeriod)[-1]))
{
    Open = Double.NaN;
}
else
{
    Open = open(period = aggregationPeriod)[displace0];
}

Open.SetDefaultColor(Color.CYAN);
Open.SetPaintingStrategy(paintStrategyDashes);
Open.SetLineWeight(lineWeight);

Open.HideBubble();

AddChartBubble(showTodayOpen and showPlotLabels and labelLocBar[plotLabelOffset], Open, "Open", Color.GRAY);Hello halcyonguy,
I could use some advise. Below is a snippet of my code. It draws a horizontal line at today's open and shows a chart bubble at the right edge of the line, near price axis. I set plotLabelOffset to 5 so it shows bubble at 5 bars in future. It works fine but just before market closes, the chart bubbles disappear.
I have this on a M5 chart, extended hours are turned off and time axis->expansion area on chart is set to 10 bars to give these bubbles enough room. This is what's happening
After Market Close:
- Extended hours turned off - setting plotLabelOffset to 0 or negative number shows bubbles.
- Extended hours turned off - setting plotLabelOffset to anything >0 does not show bubbles
- Extended hours turned on - bubbles work fine all the time
Could you please advise what in below code needs to change so that i can still see the bubbles with plotLabelOffset=5, after market closes and with extended hours turned off? Or is this not possible by design?
PS: I tried your code but didnt work for me. I am responding to your post because, from your screenshot , i see that it's a hourly chart, you have extended hours turned off and your bubble is being drawn few bars in the future and it appears you're seeing this after market close. So wondering why i'm not able to get the same to work.
Thanks in advance!
Ruby:AddChartBubble(showTodayOpen and showPlotLabels and labelLocBar[plotLabelOffset], Open, "Open", Color.GRAY);
Start a new thread and receive assistance from our community.
useThinkScript is the #1 community of stock market investors using indicators and other tools to power their trading strategies. Traders of all skill levels use our forums to learn about scripting and indicators, help each other, and discover new ways to gain an edge in the markets.
We get it. Our forum can be intimidating, if not overwhelming. With thousands of topics, tens of thousands of posts, our community has created an incredibly deep knowledge base for stock traders. No one can ever exhaust every resource provided on our site.
If you are new, or just looking for guidance, here are some helpful links to get you started.