I am looking your coders' participation to figure an indicator for TOS, I have it on my Ninja Trader-it is actually a monthly paid subscription- and prefer to have it on TOS, the vendor have no intention to develop for TOS, so maybe you guys can figure this out.
As you may know the large institutional traders uses large size orders to trade /ES,/NQ futures and beta name stocks. They buy in bulk with algos or pre-programed orders; and the other hand the retailers like you and me trade with 1-10 contracts and 100's shares vs 1000's shares.
These trades are more visible and traceable with tick charts rather than time charts-at tick charts every tick counts the number of trades and prints. With that data it is easier to sort the average trade size and labels as a pro trade or retail trade. Volume data carries two input: Tick Count and Trade Volume where this can be harvested.
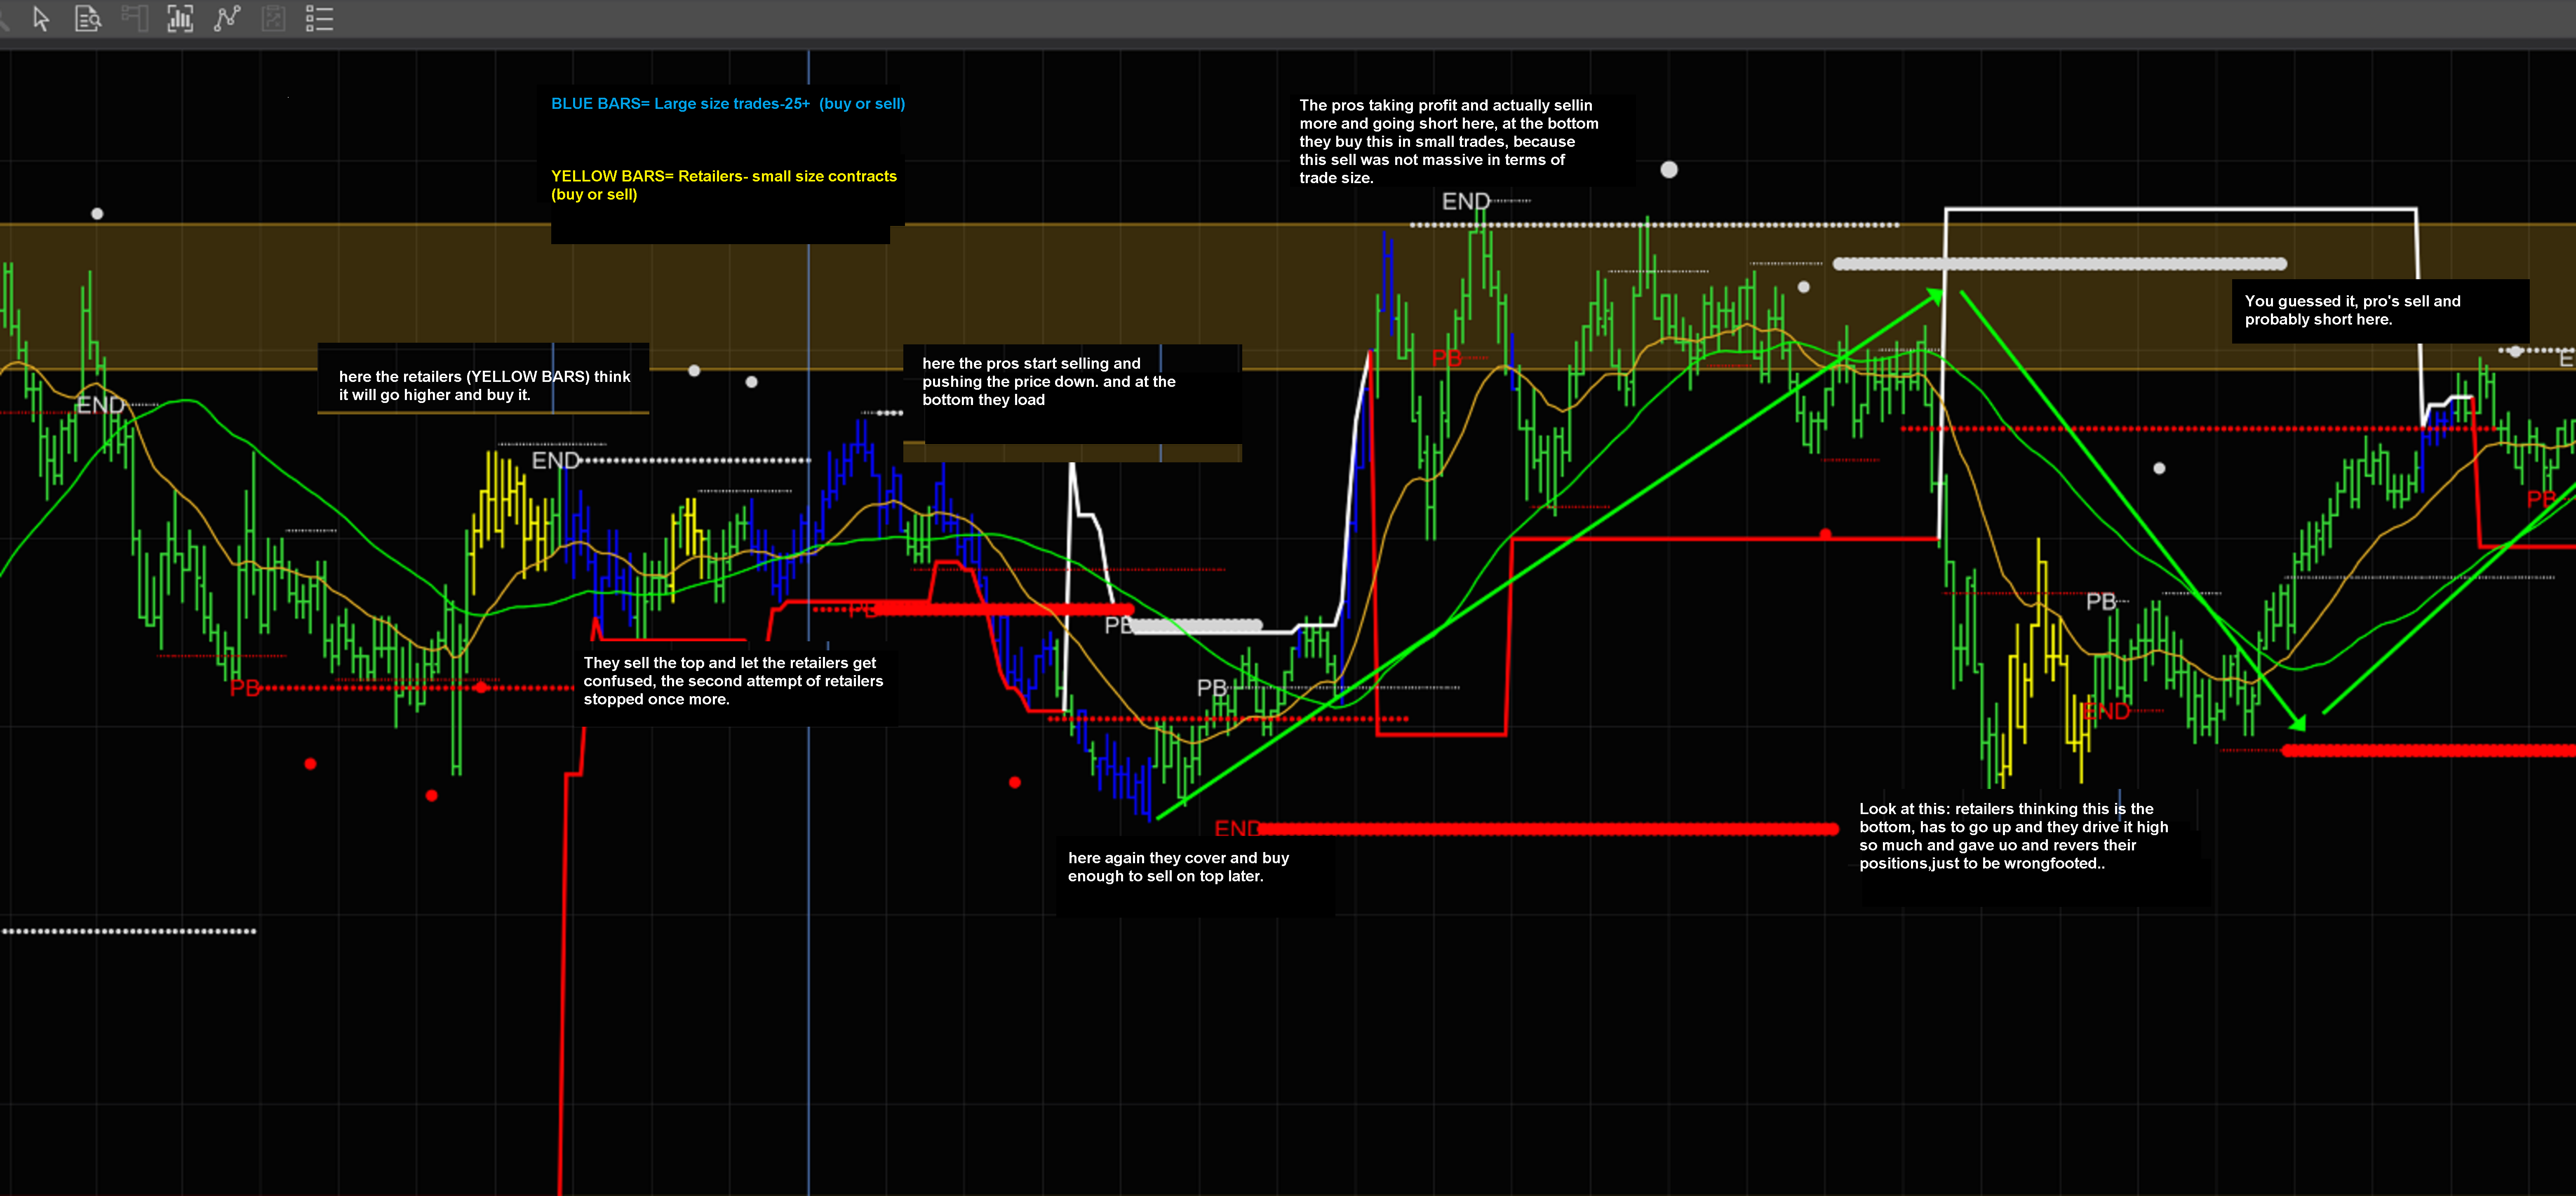
The next thing to do is plot these on the tick charts-I use 500-1500-4500 tick charts for trading ES, (changes with futures) as a blue bars for large average trades and yellow for retail trades. As you may have noticed the retailers always wrongfooted and most losing money at the trading- large traders have longs and shorts and able to move the market into their advantage- idea is able to see the large trades during the day and also even on daily equitant of tick charts. Here is a picture of my NinjaTrader screen showing the large trades in blue bars and retailers in yellow bars. Blue bars printed when the average trade in that tick is over 25.
It is more than this of course and please dont hesitate to reply or DM me regarding developing this. I am willing to compensate who can help me with this.
 I even have a primal code for thisdone for TradingView/Ninja Trader as looks like this:
As you may know the large institutional traders uses large size orders to trade /ES,/NQ futures and beta name stocks. They buy in bulk with algos or pre-programed orders; and the other hand the retailers like you and me trade with 1-10 contracts and 100's shares vs 1000's shares.
These trades are more visible and traceable with tick charts rather than time charts-at tick charts every tick counts the number of trades and prints. With that data it is easier to sort the average trade size and labels as a pro trade or retail trade. Volume data carries two input: Tick Count and Trade Volume where this can be harvested.
The next thing to do is plot these on the tick charts-I use 500-1500-4500 tick charts for trading ES, (changes with futures) as a blue bars for large average trades and yellow for retail trades. As you may have noticed the retailers always wrongfooted and most losing money at the trading- large traders have longs and shorts and able to move the market into their advantage- idea is able to see the large trades during the day and also even on daily equitant of tick charts. Here is a picture of my NinjaTrader screen showing the large trades in blue bars and retailers in yellow bars. Blue bars printed when the average trade in that tick is over 25.
It is more than this of course and please dont hesitate to reply or DM me regarding developing this. I am willing to compensate who can help me with this.
Code:
inputs ShowAvg(True), AvgLen(100);
Variables; S(0)
If (UpTicks Data2 +DownTicks Data2) <> 0 then S= (Upticks+DownTicks)/(UpTicks Data2 + (DownTicks Data2);
Plot1 (S, AvgSize")
If  showAvg then Plot2 (Average(S,AvgLen)," Avg");