

The site's search engine apparently only searches for words rather than phrases. A search for "number of bars" yields many results containing of. Useful, they is not. A post, we must create.
Ok, putting Yoda away now. =>
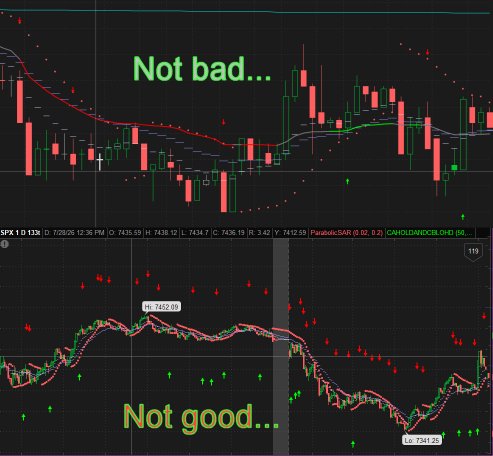
What seemed like what should be a trivial coding effort has run me headlong into a wall. One I suspect many here are all to familiar with. The goal, is to develop a means of determining placement above/below the candles for reversal markers. Sounds simple enuf and indeed they do display but the behavior varies a bit too much depending on the Price axis magnitude. For example, on $DJI the markers appear too far away from the price line whereas on a volatile <$10 stock the markers easily get lost in the noise.
From what I've been able to gather, ToS doesn't reveal the Price axis Min/Max values so developing a scale off those isn't do-able. Trying to determine the High/Low of a Zoomed/Scrolled Intraday tick chart is (impossible)? Yes, you can get some numbers but they don't correlate to what is actually displayed on the chart. Rather, they reflect the entire iData set.
Where I'm at:
For a universal placement method that takes Price axis scale magnitude into consideration the logical (IMHO) approach is to use Logarithms [Lg() in ThinkScript].
The 0.035 was chosen experimentally and is added/subtracted to the unity multiplier to bump the vertical placement position of the marker.
While this works (sort of) it is in need of further refinement. What other methods are available to evaluate?
Ok, putting Yoda away now. =>
What seemed like what should be a trivial coding effort has run me headlong into a wall. One I suspect many here are all to familiar with. The goal, is to develop a means of determining placement above/below the candles for reversal markers. Sounds simple enuf and indeed they do display but the behavior varies a bit too much depending on the Price axis magnitude. For example, on $DJI the markers appear too far away from the price line whereas on a volatile <$10 stock the markers easily get lost in the noise.
From what I've been able to gather, ToS doesn't reveal the Price axis Min/Max values so developing a scale off those isn't do-able. Trying to determine the High/Low of a Zoomed/Scrolled Intraday tick chart is (impossible)? Yes, you can get some numbers but they don't correlate to what is actually displayed on the chart. Rather, they reflect the entire iData set.
Where I'm at:
For a universal placement method that takes Price axis scale magnitude into consideration the logical (IMHO) approach is to use Logarithms [Lg() in ThinkScript].
Code:
def markerOffset = .035 - Floor(Lg(price))/100; # percent above/below to show Up/Down arrow markersThe 0.035 was chosen experimentally and is added/subtracted to the unity multiplier to bump the vertical placement position of the marker.
Code:
plot CAHOLD = if ShowCAHOLD and _CAHOLD then Lows * (1 - markerOffset) else Double.NaN;
plot CBLOHD = if ShowCBLOHD and _CBLOHD then Highs * (1 + markerOffset) else Double.NaN;
While this works (sort of) it is in need of further refinement. What other methods are available to evaluate?

