Hello all, I've been trying to turn this delta trend indicator into an Multi-timeframe label system kind of like the whole DMX/ADX 10x system.
Can anyone give me some assistance to turn the diff histogram into an MTF label?
here's the main delta trend code
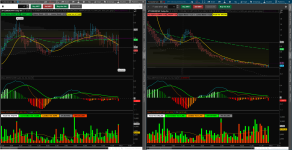
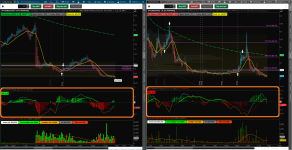
It indicates like the MACD, but instead of price like the MACD. It takes the Delta of the options and a length period in its calculations. A difference between this and the MACD, is that the when Delta is showing the RED histograms, there is strength in the put options, and green histograms shows strength in call options. Has been a helpful indicator for scalps and quick trend changes on the price chart.
If anyone can help me out, I'd greatly appreciate it. Thank you!
Can anyone give me some assistance to turn the diff histogram into an MTF label?
here's the main delta trend code
Code:
declare lower;

# Define the input parameters
input length = 20;
input showDeltaExp = yes;
input DexTrendLbl = yes;
input DexStrengthLbl = yes;
input DiffLbl = yes;


DefineGlobalColor("Bullish", Color.GREEN);
DefineGlobalColor("Bearish", Color.RED);
DefineGlobalColor("Neutral", Color.current);


# Define the plot data
def delta = Delta();
def deltaExp = TEMA(delta - delta[length]);
def deltaAccum = Sum(deltaExp, length);

# Add a zero line to the chart
plot ZeroLine = 0;
ZeroLine.SetDefaultColor(Color.GRAY);
ZeroLine.SetStyle(Curve.SHORT_DASH);


# Calculate the smoothed line using a simple moving average
def smaDeltaExp = movavgExponential(deltaExp, length);


# Plot the smoothed line
plot SmoothedLine = smaDeltaExp;
SmoothedLine.AssignValueColor(if Smoothedline > zeroline then Color.green else color.dark_red);
SmoothedLine.HideBubble();
SmoothedLine.HideTitle();

# Plot the delta expansion chart
#plot DeltaExpansion = if showDeltaExp then deltaExp else if IsNaN(deltaExp) then 0 else deltaExp;
plot DeltaExpansion = if showDeltaExp then deltaExp else Double.NaN;
#DeltaExpansion.SetPaintingStrategy(PaintingStrategy.HISTOGRAM);
DeltaExpansion.AssignValueColor(if DeltaExpansion > smoothedline then Color.CYAN else Color.Dark_orange);
DeltaExpansion.HideBubble();
DeltaExpansion.HideTitle();

# Plot The Diff
plot Diff = deltaExp - smoothedLine;
Diff.SetDefaultColor(GetColor(5));
Diff.SetPaintingStrategy(PaintingStrategy.HISTOGRAM);
Diff.SetLineWeight(3);
Diff.DefineColor("Positive and Up", Color.GREEN);
Diff.DefineColor("Positive and Down", Color.DARK_GREEN);
Diff.DefineColor("Negative and Down", Color.RED);
Diff.DefineColor("Negative and Up", Color.dark_red);
Diff.AssignValueColor(if Diff >= 0 then if Diff > Diff[1] then Diff.color("Positive and Up") else Diff.color("Positive and Down") else if Diff < Diff[1] then Diff.color("Negative and Down") else Diff.color("Negative and Up"));
It indicates like the MACD, but instead of price like the MACD. It takes the Delta of the options and a length period in its calculations. A difference between this and the MACD, is that the when Delta is showing the RED histograms, there is strength in the put options, and green histograms shows strength in call options. Has been a helpful indicator for scalps and quick trend changes on the price chart.
If anyone can help me out, I'd greatly appreciate it. Thank you!
Attachments
Last edited by a moderator: