Defining "Stop Time" For Horizontal Line At Time Study

AntMan

New member
Hello all. I can't figure out how to define a stop time for the study that I use that plots a horizontal at a specified open/high/low/close time.
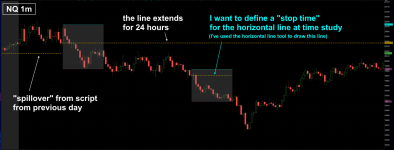
The line extends across the chart for 24 hours into the following day. A line drawn at the 9:30 open will extend until 9:30 the next day.

I want to be able to have the line stop extending at a specified time. I want to define inputs where I can adjust the starting & ending open/high/low/close times.
For example, I want to be able to have a line start at the 9:30 open and stop at the 9:59 close, and not extend forward in time, as illustrated in the attachment.

Here is the code:

Code:
declare hide_on_daily;
input time = 0930;
input price = open;
input showOnlyLastPeriod = no;
rec time_value = If(SecondsTillTime(time) == 0, price, time_value[1]);
plot open = If(time_value == 0, Double.NaN, time_value);
open.SetDefaultColor(Color.WHITE);
open.SetPaintingStrategy(PaintingStrategy.DASHES);
open.setStyle(curve.SHORT_DASH);
open.setLineWeight(2);


Thanks in advance!
 

Attachments

  • Screenshot 2024-09-21 20.24.24.png
    Screenshot 2024-09-21 20.24.24.png
    204.1 KB · Views: 43
Solution
Hello all. I can't figure out how to define a stop time for the study that I use that plots a horizontal at a specified open/high/low/close time.
The line extends across the chart for 24 hours into the following day. A line drawn at the 9:30 open will extend until 9:30 the next day.

I want to be able to have the line stop extending at a specified time. I want to define inputs where I can adjust the starting & ending open/high/low/close times.
For example, I want to be able to have a line start at the 9:30 open and stop at the 9:59 close, and not extend forward in time, as illustrated in the attachment.

Here is the code:

Code:
declare hide_on_daily;
input time = 0930;
input price = open;
input showOnlyLastPeriod = no;
rec time_value...
Hello all. I can't figure out how to define a stop time for the study that I use that plots a horizontal at a specified open/high/low/close time.
The line extends across the chart for 24 hours into the following day. A line drawn at the 9:30 open will extend until 9:30 the next day.

I want to be able to have the line stop extending at a specified time. I want to define inputs where I can adjust the starting & ending open/high/low/close times.
For example, I want to be able to have a line start at the 9:30 open and stop at the 9:59 close, and not extend forward in time, as illustrated in the attachment.

Here is the code:

Code:
declare hide_on_daily;
input time = 0930;
input price = open;
input showOnlyLastPeriod = no;
rec time_value = If(SecondsTillTime(time) == 0, price, time_value[1]);
plot open = If(time_value == 0, Double.NaN, time_value);
open.SetDefaultColor(Color.WHITE);
open.SetPaintingStrategy(PaintingStrategy.DASHES);
open.setStyle(curve.SHORT_DASH);
open.setLineWeight(2);


Thanks in advance!

This should work using a work around for TOS limitations on use of constants in functions
The work around formula for 'minutes' may need adjustments at year end or otherwise, but has worked on what I have tested so far.
The script function was used to define the HLCO values to plot the lines from the start time
The colors of the lines and the start and end times can be controlled at the input screen


Code:
#HLCO_Range_Market_Times_Using_Automatic_Calculation_Of_Minutes

script times {
    input coverHLOnly = no;
    input a1 = 0930;
    input b1 = 1600;
    def minutes = If(a1 > b1, 
((2300 - RoundDown(a1, -2)) / 100 * 60) + (RoundDown(b1, -2) / 100) * 60,                                 
((RoundDown(b1, -2) / 100) - (RoundDown(a1, -2) / 100)) * 60) +                 
If(a1 > b1, 60 - (a1 - Floor(a1 / 100) * 100) + (b1 - Floor(b1 / 100) * 100), (b1 - Floor(b1 / 100) * 100) - (a1 - Floor(a1 / 100) * 100)) + 1;
    def sec1    = SecondsFromTime(a1);
    def sec2    = SecondsFromTime(b1);
    def isTime1 = (sec1 >= 0 and sec1[1] <= 0) or (sec1 < sec1[1] and sec1 >= 0);
    def isTime2 = (sec2 > 0 and sec2[1] <= 0) or (sec2 < sec2[1] and sec2 > 0);
    def topaint = CompoundValue(1, if isTime1 then 1 else if isTime2 then 0 else topaint[1], 0);

    def dayh    = if topaint[1] == 1 and topaint == 0
              then high
              else if topaint == 1
              then Max(high, dayh[1])
              else 0;
    def dayhi   = if topaint[1] == 1 and topaint == 0
              then dayh[1]
              else dayhi[1];
    def dayl    = if topaint[1] == 0 and topaint == 1
              then low
              else if topaint == 1
              then Min(low, dayl[1]) else 0 ;
    def daylo   = if topaint[1] == 1 and topaint == 0
              then dayl[1]
              else daylo[1];
    def dayc    = if topaint[1] == 0 and topaint == 1
              then close
              else if topaint == 1
              then close
              else 0;
    def daycl   = if topaint[1] == 1 and topaint == 0
              then dayc[1]
              else daycl[1];
    def dayo    = if topaint[1] == 1 and topaint == 0
              then open[-1]
              else if topaint == 0
              then open[-1]
              else 0;
    def dayop   = if topaint[1] == 0 and topaint == 1
              then dayo[1]
              else dayop[1];

    plot up      = if GetDay() <= GetLastDay() and topaint
              then if coverHLOnly == no
                   then Double.POSITIVE_INFINITY
                   else dayhi[-minutes / (GetAggregationPeriod() / 60000)]     
              else Double.NaN;

    plot down    = if GetDay() <= GetLastDay() and topaint
              then if coverHLOnly == no
                   then Double.NEGATIVE_INFINITY
                   else daylo[-minutes / (GetAggregationPeriod() / 60000)]       
              else Double.NaN;
    plot cend   = if GetDay() <= GetLastDay() and topaint
              then if coverHLOnly == no
                   then Double.NEGATIVE_INFINITY
                   else daycl[-minutes / (GetAggregationPeriod() / 60000)]       
              else Double.NaN;
    plot op     = if GetDay() <= GetLastDay() and topaint
              then if coverHLOnly == no
                   then Double.NEGATIVE_INFINITY
                   else dayop[-minutes / (GetAggregationPeriod() / 60000)]       
              else Double.NaN;
}

input coverHLOnly = yes;
input show_cloud  = yes;
input start1 = 0930;
input end1   = 0959;
plot up1     = times(coverHLOnly, start1, end1);
plot down1   = times(coverHLOnly, start1, end1).down;
plot close1  = times(coverHLOnly, start1, end1).cend;
plot open1   = if SecondsFromTime(start1) < 0 or SecondsFromTime(end1) > 0 then Double.NaN else times(coverHLOnly, start1, end1).dayop;
up1.SetPaintingStrategy(PaintingStrategy.DASHES);
down1.SetPaintingStrategy(PaintingStrategy.HORIZONTAL);
close1.SetPaintingStrategy(PaintingStrategy.DASHES);
open1.SetPaintingStrategy(PaintingStrategy.POINTS);

DefineGlobalColor("H", Color.GREEN);
DefineGlobalColor("L", Color.RED);
DefineGlobalColor("O", Color.WHITE);
DefineGlobalColor("C", Color.YELLOW);
up1.SetDefaultColor(GlobalColor("H"));
down1.SetDefaultColor(GlobalColor("L"));
close1.SetDefaultColor(GlobalColor("C"));
open1.SetDefaultColor(GlobalColor("O"));

# Cloud **************
DefineGlobalColor("Cloud", Color.CYAN);
AddCloud(if show_cloud then up1 else Double.NaN, down1, GlobalColor("Cloud"), GlobalColor("Cloud"));

#
 
Solution

Join useThinkScript to post your question to a community of 21,000+ developers and traders.

This should work using a work around for TOS limitations on use of constants in functions
The work around formula for 'minutes' may need adjustments at year end or otherwise, but has worked on what I have tested so far.
The script function was used to define the HLCO values to plot the lines from the start time
The colors of the lines and the start and end times can be controlled at the input screen

The following is an improvement to the above code to start plotting the high/low/open from the start rather than waiting until the end of the times. The close line will still need to wait until the end to plot.

The image shows on the last day the developing high/low and open lines. The first day shown shows all of the lines plotted when the end of the times had been reached.


Code:
#HLCO_Range_Market_Times_Using_Automatic_Calculation_Of_Minutes
#

script times {

    input a1           = 0930;
    input b1           = 1600;
    input showlastonly = no;
    input extend_line  = yes;

# Minutes #### Calculates the length between times a1 and b1 used to plot Close line back to sec1 onset
    def minutes = If(a1 > b1,
((2300 - RoundDown(a1, -2)) / 100 * 60) + (RoundDown(b1, -2) / 100) * 60,                               
((RoundDown(b1, -2) / 100) - (RoundDown(a1, -2) / 100)) * 60) +               
If(a1 > b1, 60 - (a1 - Floor(a1 / 100) * 100) + (b1 - Floor(b1 / 100) * 100), (b1 - Floor(b1 / 100) * 100) - (a1 - Floor(a1 / 100) * 100)) + 1;

# Range   #### Defines range from a1 to b1
    def sec1    = SecondsFromTime(a1);
    def sec2    = SecondsFromTime(b1);
    def inrange = CompoundValue(1, if sec1 == 0 then 1 else if sec2 > 0 then 0 else inrange[1], 0);

# Volumeprofile used to defineColor High/Low to start plotting at sec1 onset
    def bars   = 20000;
    def period = BarNumber() - 1 ;

    def count = CompoundValue(1, if inrange and period != period[1] then (count[1] + period - period[1]) % bars else count[1], 0) ;
    def cond = count < count[1] + period - period[1];

    profile vol     = VolumeProfile("startNewProfile" = cond[1], "onExpansion" = no);
    def hProfile    = if inrange and IsNaN(vol.GetHighest()) then hProfile[1] else vol.GetHighest();
    def lProfile    = if inrange and IsNaN(vol.GetLowest())  then lProfile[1] else vol.GetLowest();
    def ProfileHigh = if inrange then hProfile else if extend_line then ProfileHigh[1] else Double.NaN;
    def ProfileLow  = if inrange then lProfile else if extend_line then ProfileLow[1] else Double.NaN;

    def dataCount = CompoundValue(1, if cond != cond[1] then dataCount[1] + 1 else dataCount[1]  , 0);

# High #### using Volumeprofile
    plot hrange = if !showlastonly then ProfileHigh
                  else if showlastonly and  HighestAll(dataCount) - dataCount <= if b1 <= 0000 then 2 else 1
                  then ProfileHigh else Double.NaN;
# Low #### using Volumeprofile
    plot lrange = if !showlastonly then ProfileLow
                  else if showlastonly and HighestAll(dataCount) -
                          dataCount <= if b1 <= 0000 then 2 else 1
                  then ProfileLow  else Double.NaN;
# Open #### using sec1 and sec2
    def o       = if sec1 == 0
                  then open
                  else if !extend_line and sec2 <= 0
                  then o[1]
                  else if extend_line then o[1] else Double.NaN;
    plot orange = if !showlastonly then o
                  else if showlastonly and HighestAll(dataCount) -
                          dataCount <= if b1 <= 0000 then 2 else 1
                  then o else Double.NaN;
# Close #### using inrange and minutes offset
    def dayc    = if inrange[1] == 0 and inrange == 1
                  then close
                  else if inrange == 1
                  then close
                  else 0;
    def daycl   = if inrange[1] == 1 and inrange == 0
                  then dayc[1]
                  else daycl[1];
    plot cend   = if showlastonly and GetDay() != GetLastDay()
                  then Double.NaN
                  else if GetDay() <= GetLastDay() and inrange
                  then daycl[-minutes / (GetAggregationPeriod() / 60000)]
                  else if extend_line and sec2 > 0 then daycl[1]   
                  else Double.NaN;

}   # End Times Script

input showlastonly = no;
input show_cloud   = yes;
input start1       = 0930;
input end1         = 0959;
input extendline   = no;

plot high1   = times(start1, end1, showlastonly = showlastonly, extend_line = extendline).hrange;
plot low1    = times(start1, end1, showlastonly = showlastonly, extend_line = extendline).lrange;
plot close1  = times(start1, end1, showlastonly = showlastonly, extend_line = extendline).cend;
plot open1   = times(start1, end1, showlastonly = showlastonly, extend_line = extendline).orange;#
close1.SetPaintingStrategy(PaintingStrategy.DASHES);
open1.SetPaintingStrategy(PaintingStrategy.POINTS);

DefineGlobalColor("H", Color.GREEN);
DefineGlobalColor("L", Color.RED);
DefineGlobalColor("O", Color.WHITE);
DefineGlobalColor("C", Color.YELLOW);
high1.SetDefaultColor(GlobalColor("H"));
low1.SetDefaultColor(GlobalColor("L"));
close1.SetDefaultColor(GlobalColor("C"));
open1.SetDefaultColor(GlobalColor("O"));

# Cloud **************
DefineGlobalColor("Cloud", Color.LIGHT_GRAY);
AddCloud(if show_cloud then high1 else Double.NaN, low1, GlobalColor("Cloud"), GlobalColor("Cloud"));

# End Code
 
Last edited:

Not the exact question you're looking for?

Start a new thread and receive assistance from our community.

87k+ Posts
297 Online
Create Post

The Market Trading Game Changer

Join 2,500+ subscribers inside the useThinkScript VIP Membership Club
  • Exclusive indicators
  • Proven strategies & setups
  • Private Discord community
  • ‘Buy The Dip’ signal alerts
  • Exclusive members-only content
  • Add-ons and resources
  • 1 full year of unlimited support

Frequently Asked Questions

What is useThinkScript?

useThinkScript is the #1 community of stock market investors using indicators and other tools to power their trading strategies. Traders of all skill levels use our forums to learn about scripting and indicators, help each other, and discover new ways to gain an edge in the markets.

How do I get started?

We get it. Our forum can be intimidating, if not overwhelming. With thousands of topics, tens of thousands of posts, our community has created an incredibly deep knowledge base for stock traders. No one can ever exhaust every resource provided on our site.

If you are new, or just looking for guidance, here are some helpful links to get you started.

What are the benefits of VIP Membership?
VIP members get exclusive access to these proven and tested premium indicators: Buy the Dip, Advanced Market Moves 2.0, Take Profit, and Volatility Trading Range. In addition, VIP members get access to over 50 VIP-only custom indicators, add-ons, and strategies, private VIP-only forums, private Discord channel to discuss trades and strategies in real-time, customer support, trade alerts, and much more. Learn all about VIP membership here.
How can I access the premium indicators?
To access the premium indicators, which are plug and play ready, sign up for VIP membership here.
Back
Top