AntMan
New member
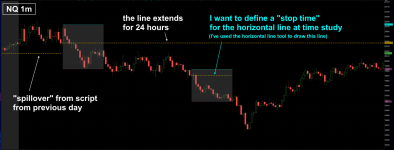
Hello all. I can't figure out how to define a stop time for the study that I use that plots a horizontal at a specified open/high/low/close time.
The line extends across the chart for 24 hours into the following day. A line drawn at the 9:30 open will extend until 9:30 the next day.
I want to be able to have the line stop extending at a specified time. I want to define inputs where I can adjust the starting & ending open/high/low/close times.
For example, I want to be able to have a line start at the 9:30 open and stop at the 9:59 close, and not extend forward in time, as illustrated in the attachment.
Here is the code:
Thanks in advance!
The line extends across the chart for 24 hours into the following day. A line drawn at the 9:30 open will extend until 9:30 the next day.
I want to be able to have the line stop extending at a specified time. I want to define inputs where I can adjust the starting & ending open/high/low/close times.
For example, I want to be able to have a line start at the 9:30 open and stop at the 9:59 close, and not extend forward in time, as illustrated in the attachment.
Here is the code:
Code:
declare hide_on_daily;
input time = 0930;
input price = open;
input showOnlyLastPeriod = no;
rec time_value = If(SecondsTillTime(time) == 0, price, time_value[1]);
plot open = If(time_value == 0, Double.NaN, time_value);
open.SetDefaultColor(Color.WHITE);
open.SetPaintingStrategy(PaintingStrategy.DASHES);
open.setStyle(curve.SHORT_DASH);
open.setLineWeight(2);
Thanks in advance!