debugging chatGPT (and other AI) for ThinkOrSwim

johnwood34

New member
VIP
I'm having an issue with a small portion of this script. Can anyone help me with it? Providing a snapshot of my screen as to what i'm being prompted with...
20250113_224549.jpg

Code:
declare upper;

# Inputs
input fastSMA_length = 50; # Fast moving average (50-period)
input slowSMA_length = 200; # Slow moving average (200-period)
input rsi_length = 14; # RSI period (14-period)
input macd_shortLength = 12; # MACD short period (12) -- Updated to 12
input macd_longLength = 26; # MACD long period (26) -- Updated to 26
input macd_signalLength = 9; # MACD signal period (9) -- Updated to 9
input volumeLength = 20; # Volume average period (20)
input overbought = 70; # Overbought level for RSI (70)
input oversold = 30; # Oversold level for RSI (30)
input showSignals = yes; # Toggle to show signals

# Calculate Moving Averages
def fastSMA = Average(close, fastSMA_length); # Fast SMA (50-period)
def slowSMA = Average(close, slowSMA_length); # Slow SMA (200-period)

# Calculate RSI
def rsi = RSI(rsi_length);

# Calculate MACD
def macdValue = MACD(fastLength = macd_shortLength, slowLength = macd_longLength, MACDLength = macd_signalLength).MACD;
def signalLine = MACD(fastLength = macd_shortLength, slowLength = macd_longLength, MACDLength = macd_signalLength).Signal;

# Calculate Volume
def avgVolume = Average(volume, volumeLength);
def highVolume = volume > avgVolume; # High volume signal

# Bullish and Bearish Engulfing Candlestick Patterns (simplified)
def bullishEngulfing = close > open and close[1] < open[1] and close > open[1] and open < close[1];
def bearishEngulfing = open > close and open[1] < close[1] and open > close[1] and close < open[1];

# Buy Signal Logic
def buySignal = (fastSMA crosses above slowSMA) and (rsi < oversold) and (macdValue crosses above signalLine) and highVolume and bullishEngulfing;

# Sell Signal Logic
def sellSignal = (fastSMA crosses below slowSMA) and (rsi > overbought) and (macdValue crosses below signalLine) and highVolume and bearishEngulfing;

# Plot Buy and Sell Signals
plot BuySignalPlot = if showSignals and buySignal then low - 0.5 else Double.NaN;
BuySignalPlot.SetPaintingStrategy(PaintingStrategy.ARROW_UP);
BuySignalPlot.SetDefaultColor(Color.GREEN);
BuySignalPlot.SetLineWeight(3);

plot SellSignalPlot = if showSignals and sellSignal then high + 0.5 else Double.NaN;
SellSignalPlot.SetPaintingStrategy(PaintingStrategy.ARROW_DOWN);
SellSignalPlot.SetDefaultColor(Color.RED);
SellSignalPlot.SetLineWeight(3);
 
Last edited by a moderator:
chatGPT creates many errors
sUoNxp3.png


Here are some suggestions when debugging:
1. ThinkScript shows the LAST error
2. You must scroll up through the errors to see the FIRST error

In this case: chatGPT invented plots that don't exist
Open Inspector and it will display the real plot names.
Click on the real ones.

And then go on to the next error.
chatGPT creates a lot of errors.


Here is the corrected code:
Ruby:
declare upper;

# Inputs
input fastSMA_length = 50; # Fast moving average (50-period)
input slowSMA_length = 200; # Slow moving average (200-period)
input rsi_length = 14; # RSI period (14-period)
input macd_shortLength = 12; # MACD short period (12) -- Updated to 12
input macd_longLength = 26; # MACD long period (26) -- Updated to 26
input macd_signalLength = 9; # MACD signal period (9) -- Updated to 9
input volumeLength = 20; # Volume average period (20)
input overbought = 70; # Overbought level for RSI (70)
input oversold = 30; # Oversold level for RSI (30)
input showSignals = yes; # Toggle to show signals

# Calculate Moving Averages
def fastSMA = Average(close, fastSMA_length); # Fast SMA (50-period)
def slowSMA = Average(close, slowSMA_length); # Slow SMA (200-period)

# Calculate RSI
def rsi = RSI(rsi_length);

# Calculate MACD
def macdValue = MACD(fastLength = macd_shortLength, slowLength = macd_longLength, MACDLength = macd_signalLength).value;
def signalLine = MACD(fastLength = macd_shortLength, slowLength = macd_longLength, MACDLength = macd_signalLength).Avg;

# Calculate Volume
def avgVolume = Average(volume, volumeLength);
def highVolume = volume > avgVolume; # High volume signal

# Bullish and Bearish Engulfing Candlestick Patterns (simplified)
def bullishEngulfing = close > open and close[1] < open[1] and close > open[1] and open < close[1];
def bearishEngulfing = open > close and open[1] < close[1] and open > close[1] and close < open[1];

# Buy Signal Logic
def buySignal = (fastSMA crosses above slowSMA) and (rsi < oversold) and (macdValue crosses above signalLine) and highVolume and bullishEngulfing;

# Sell Signal Logic
def sellSignal = (fastSMA crosses below slowSMA) and (rsi > overbought) and (macdValue crosses below signalLine) and highVolume and bearishEngulfing;

# Plot Buy and Sell Signals
plot BuySignalPlot = if showSignals and buySignal then low - 0.5 else Double.NaN;
BuySignalPlot.SetPaintingStrategy(PaintingStrategy.ARROW_UP);
BuySignalPlot.SetDefaultColor(Color.GREEN);
BuySignalPlot.SetLineWeight(3);

plot SellSignalPlot = if showSignals and sellSignal then high + 0.5 else Double.NaN;
SellSignalPlot.SetPaintingStrategy(PaintingStrategy.ARROW_DOWN);
SellSignalPlot.SetDefaultColor(Color.RED);
SellSignalPlot.SetLineWeight(3);
 
Thank you! Now how do I delete my original post?

If you've faced this issue, chances are thousands of others might too.

Your post helps many avoid similar frustrations.
It's the active participation and knowledge-sharing of members that make useThinkScript great.
 
chatGPT creates many errors
sUoNxp3.png


Here are some suggestions when debugging:
1. ThinkScript shows the LAST error
2. You must scroll up through the errors to see the FIRST error

In this case: chatGPT invented plots that don't exist
Open Inspector and it will display the real plot names.
Click on the real ones.

And then go on to the next error.
chatGPT creates a lot of errors.


Here is the corrected code:
Ruby:
declare upper;

# Inputs
input fastSMA_length = 50; # Fast moving average (50-period)
input slowSMA_length = 200; # Slow moving average (200-period)
input rsi_length = 14; # RSI period (14-period)
input macd_shortLength = 12; # MACD short period (12) -- Updated to 12
input macd_longLength = 26; # MACD long period (26) -- Updated to 26
input macd_signalLength = 9; # MACD signal period (9) -- Updated to 9
input volumeLength = 20; # Volume average period (20)
input overbought = 70; # Overbought level for RSI (70)
input oversold = 30; # Oversold level for RSI (30)
input showSignals = yes; # Toggle to show signals

# Calculate Moving Averages
def fastSMA = Average(close, fastSMA_length); # Fast SMA (50-period)
def slowSMA = Average(close, slowSMA_length); # Slow SMA (200-period)

# Calculate RSI
def rsi = RSI(rsi_length);

# Calculate MACD
def macdValue = MACD(fastLength = macd_shortLength, slowLength = macd_longLength, MACDLength = macd_signalLength).value;
def signalLine = MACD(fastLength = macd_shortLength, slowLength = macd_longLength, MACDLength = macd_signalLength).Avg;

# Calculate Volume
def avgVolume = Average(volume, volumeLength);
def highVolume = volume > avgVolume; # High volume signal

# Bullish and Bearish Engulfing Candlestick Patterns (simplified)
def bullishEngulfing = close > open and close[1] < open[1] and close > open[1] and open < close[1];
def bearishEngulfing = open > close and open[1] < close[1] and open > close[1] and close < open[1];

# Buy Signal Logic
def buySignal = (fastSMA crosses above slowSMA) and (rsi < oversold) and (macdValue crosses above signalLine) and highVolume and bullishEngulfing;

# Sell Signal Logic
def sellSignal = (fastSMA crosses below slowSMA) and (rsi > overbought) and (macdValue crosses below signalLine) and highVolume and bearishEngulfing;

# Plot Buy and Sell Signals
plot BuySignalPlot = if showSignals and buySignal then low - 0.5 else Double.NaN;
BuySignalPlot.SetPaintingStrategy(PaintingStrategy.ARROW_UP);
BuySignalPlot.SetDefaultColor(Color.GREEN);
BuySignalPlot.SetLineWeight(3);

plot SellSignalPlot = if showSignals and sellSignal then high + 0.5 else Double.NaN;
SellSignalPlot.SetPaintingStrategy(PaintingStrategy.ARROW_DOWN);
SellSignalPlot.SetDefaultColor(Color.RED);
SellSignalPlot.SetLineWeight(3);

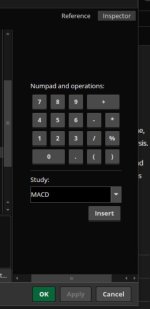
i have never used the inspector.
i keep a few tabs open in browser, to several thinkscript function pages.

how did you get it to show a list of plots?
it just shows me a keypad of numbers.
 

Attachments

  • img1.JPG
    img1.JPG
    26.2 KB · Views: 20
i have never used the inspector.
i keep a few tabs open in browser, to several thinkscript function pages.

how did you get it to show a list of plots?
it just shows me a keypad of numbers.
oops....
You are correct.
I left out a step...
You must have your cursor on the ToS function that is showing the error
or type in the function being referenced and the inspector will provide all the settings
 

Join useThinkScript to post your question to a community of 21,000+ developers and traders.

Similar threads

Not the exact question you're looking for?

Start a new thread and receive assistance from our community.

87k+ Posts
391 Online
Create Post

Similar threads

Similar threads

The Market Trading Game Changer

Join 2,500+ subscribers inside the useThinkScript VIP Membership Club
  • Exclusive indicators
  • Proven strategies & setups
  • Private Discord community
  • ‘Buy The Dip’ signal alerts
  • Exclusive members-only content
  • Add-ons and resources
  • 1 full year of unlimited support

Frequently Asked Questions

What is useThinkScript?

useThinkScript is the #1 community of stock market investors using indicators and other tools to power their trading strategies. Traders of all skill levels use our forums to learn about scripting and indicators, help each other, and discover new ways to gain an edge in the markets.

How do I get started?

We get it. Our forum can be intimidating, if not overwhelming. With thousands of topics, tens of thousands of posts, our community has created an incredibly deep knowledge base for stock traders. No one can ever exhaust every resource provided on our site.

If you are new, or just looking for guidance, here are some helpful links to get you started.

What are the benefits of VIP Membership?
VIP members get exclusive access to these proven and tested premium indicators: Buy the Dip, Advanced Market Moves 2.0, Take Profit, and Volatility Trading Range. In addition, VIP members get access to over 50 VIP-only custom indicators, add-ons, and strategies, private VIP-only forums, private Discord channel to discuss trades and strategies in real-time, customer support, trade alerts, and much more. Learn all about VIP membership here.
How can I access the premium indicators?
To access the premium indicators, which are plug and play ready, sign up for VIP membership here.
Back
Top