Daily range script scan - Error / Omission

SCALPER

New member
Hello,

Today 4/9/21, I found an error / omission using the following daily range script -

(((highest(high[1],20) – lowest(low[1],20)) / lowest(low[1],20)) * 100) >= 100

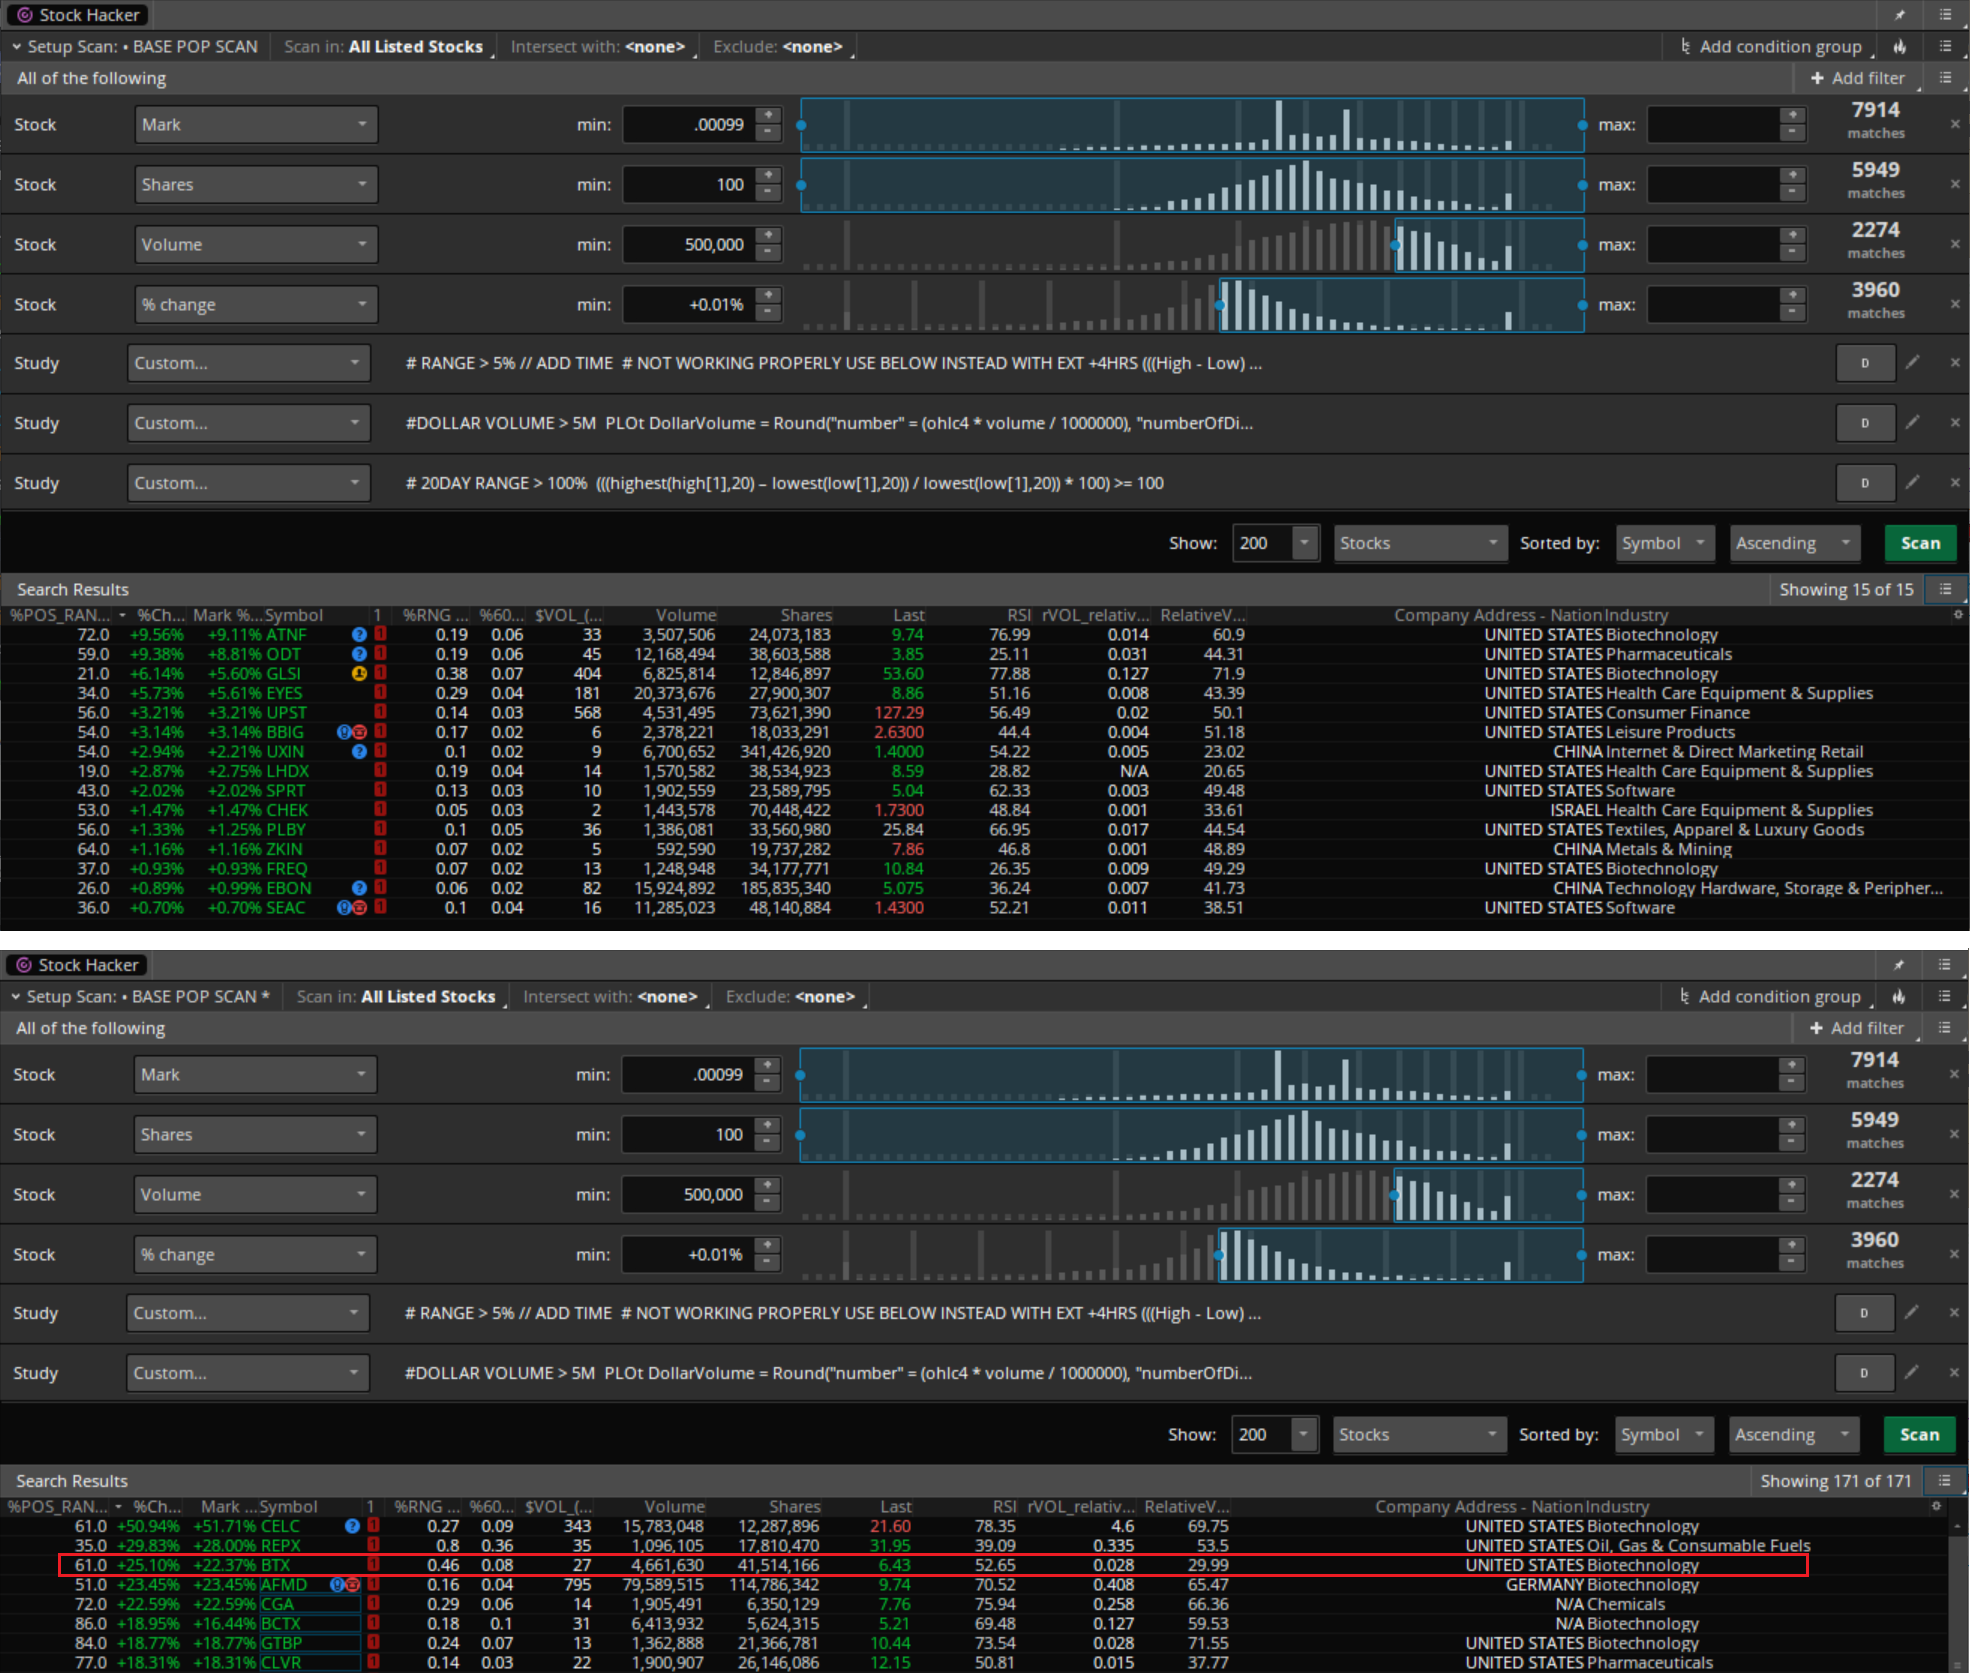
Specifically, it omitted BTX with a 20 day range from 3.59 - 10.28 or 186.4%

Any help with a modification or working script is greatly appreciated.


Direct link to the Scan Query
Screenshots of the results w/ and w/out the script -
ndI2X6a.png
 

Join useThinkScript to post your question to a community of 21,000+ developers and traders.

@rad14733 ... Hi, I asked for basic code to determine the highest / lowest values in the thinkScript Lounge chat in TOS and pieced together the script using a percentage formula to define the range. I wasn't able to find much regarding ranges in here and hope someone is able to solve the error.
 
@rad14733 ... Hi, I asked for basic code to determine the highest / lowest values in the thinkScript Lounge chat in TOS and pieced together the script using a percentage formula to define the range. I wasn't able to find much regarding ranges in here and hope someone is able to solve the error.

I don't bother with Thinkscript Lounge... I've visited several times but have found it to be a waste, overall...

That being said, we can't help if you don't post images of the Thinkscript or Condition Wizard code from your custom filters...
 
I hear you and appreciate the assistance. I'm a noob when it comes to coding but I believe the logic is sound.

Here is the Scan Query. To simplify things I deleted the additional custom filters except for the predefined parameters and the custom range script -
(((highest(high[1],20) – lowest(low[1],20)) / lowest(low[1],20)) * 100) >= 100

The screenshot shows BTX is not listed when the custom range script is run, yet it should be included since its 20 day range is 3.59 - 10.28 or 186.4%. Chances are I am using the wrong code to define the highest high and lowest low of the range resulting in the error / omission.

K6Jhw9O.png
 
@SCALPER Good News Bad News
Good News, your logic and syntax in your script is doing just what you want it to.
zbNOWmc.png

In my personal experience, pasting scripts directly into the scanner can hide issues and sometimes give unreliable results. So I put your code into a study.
Ruby:
input length = 20;

plot LowerBand = Lowest(low[1], length);
plot UpperBand = Highest(high[1], length);
plot Diff      = UpperBand - LowerBand ;
plot range = Diff / Lowerband *100 ;
range.hide();
plot test = range > 100 ;
AddChartBubble(IsNaN(close[-1]), close, "HighestHi: " + Highest(high[1], 20) + " |" + "LowestLow: " + Lowest(low[1], 20) + " | " + "Range: " +range  , color = Color.ORANGE);
I ran the study through the scanner. It got really ugly. I got the following error AND it froze and corrupted my TOS app.
ecmRMKu.png

My experience has been that scripts that result in the above error message mean that your code will not run in the TOS scanner. It might be taking too many resources. I have no idea, when people start explaining program errors to me, my brain turns off. If you are intensely interested in why this code will not run, you could try calling TOS support.
Sorry, it was a neat idea for a code.
 
its the golden study! they dont want you to have it! its the secret to profitability! :ROFLMAO:

yea you will have to call tos support if it errors on your TOS as well, since im not willing to corrupt my TOS app im not really trying to test it, ill take @MerryDay 's word for it :oops:
 
@MerryDay I piggybacked off the idea to reformat. The updated study yields the omitted ticker without an unexpected error. @XeoNoX behold the "golden study" -

Code:
# Range >= %
# Scalper - 04/11/2021
# Change 20 / 50 in example below to desired time interval / percentage
# Maximum time limitation undetermined

Def H = highest(high[1],20);
Def L = lowest(low[1],20);
Def Range = ((H – L) / L) *100;

Plot scan = Range >= 50;

If anyone finds a glitch / omission please chime in.
Cheers
 
Last edited:
The formula below has a glitch. It omits any result that has traded less than 90 days, even if the range parameter is met -
Code:
Def H = highest(high[1],90);
Def L = lowest(low[1],90);
Def Range = ((H – L) / L) *100;
Plot scan = Range >= 200;
Example -
• ALF - has traded for roughly 35 days and the percentage range is over 580%.
• Several recent IPOs would likely be omitted as well.

When a second formula is added, below the 35 day threshold, ALF is still omitted -
Code:
Def H90 = highest(high[1],90);
Def L90 = lowest(low[1],90);
Def R90 = ((H90 – L90) / L90) *100;

Def H20 = highest(high[1],20);
Def L20 = lowest(low[1],20);
Def R20 = ((H20 – L20) / L20) *100;

Plot scan = ( R90 >= 200 OR R20 >= 100 );

The only way ALF will show up as a result is if the number of days it's actively traded is greater than the specified number of days in the formula(s).

I attempted to add a IF condition that results in double.nan if the days traded were less than the specified number in the formula.
These lines were added to the code above and tested separately without any luck -
Code:
R90 >= if barnumber()>=90 then 200 else double.nan );
Def R90 = if barnumber()>=90 then (((H90 – L90) / L90) *100) else double.nan;

Out of options... any help is appreciated in finding a solution.
 

Similar threads

Not the exact question you're looking for?

Start a new thread and receive assistance from our community.

87k+ Posts
321 Online
Create Post

Similar threads

Similar threads

The Market Trading Game Changer

Join 2,500+ subscribers inside the useThinkScript VIP Membership Club
  • Exclusive indicators
  • Proven strategies & setups
  • Private Discord community
  • ‘Buy The Dip’ signal alerts
  • Exclusive members-only content
  • Add-ons and resources
  • 1 full year of unlimited support

Frequently Asked Questions

What is useThinkScript?

useThinkScript is the #1 community of stock market investors using indicators and other tools to power their trading strategies. Traders of all skill levels use our forums to learn about scripting and indicators, help each other, and discover new ways to gain an edge in the markets.

How do I get started?

We get it. Our forum can be intimidating, if not overwhelming. With thousands of topics, tens of thousands of posts, our community has created an incredibly deep knowledge base for stock traders. No one can ever exhaust every resource provided on our site.

If you are new, or just looking for guidance, here are some helpful links to get you started.

What are the benefits of VIP Membership?
VIP members get exclusive access to these proven and tested premium indicators: Buy the Dip, Advanced Market Moves 2.0, Take Profit, and Volatility Trading Range. In addition, VIP members get access to over 50 VIP-only custom indicators, add-ons, and strategies, private VIP-only forums, private Discord channel to discuss trades and strategies in real-time, customer support, trade alerts, and much more. Learn all about VIP membership here.
How can I access the premium indicators?
To access the premium indicators, which are plug and play ready, sign up for VIP membership here.
Back
Top