Hi Team,
I hope everyone had a productive and profitable week!
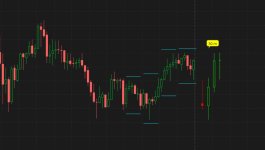
I am looking for a study that can show, on the one minute chart, the daily candle on the expansion area. In other words, the daily candle positioned to the right side of the 1-min price action. I know there is a post here on UTS but I was not able to find it again. Can somebody help to locate it or provide me with the script?
Something like this: https://www.tradingview.com/script/KmKd6B7j-TTM-HTF-Candle-Overlay-Power-of-3/
I hope everyone had a productive and profitable week!
I am looking for a study that can show, on the one minute chart, the daily candle on the expansion area. In other words, the daily candle positioned to the right side of the 1-min price action. I know there is a post here on UTS but I was not able to find it again. Can somebody help to locate it or provide me with the script?
Something like this: https://www.tradingview.com/script/KmKd6B7j-TTM-HTF-Candle-Overlay-Power-of-3/
Last edited: