i don't think this can be done as you describe. it would require 100's of variables.
below is something that looks at close prices, and plots 10 different lines at a time
there are no arrays, so no collecting data. those common price levels already exist.
there are about 250 days in a year. with 4 data points, that would be up to a 1000 variables to configure.
this will be true during the last 250 bars on the chart,
def rng = (!isnan(close) and isnan(close[-bars]));
compare open to other opens? or to any of the other prices?
on every bar, 4 loops (for the 4 price levels on that bar) would have to sequence through all the remaining bars, and look for a match.
there could be dozens, or 100s of lines to plot.
this would require more variables, to hold past counts, to compare to.
--------------------
here is something to experiment with.
it looks at just the close prices, from the last 250 bars(about a years worth on a daily chart).
it compares current bar close, to all the remaining close prices.
if a future price is near the current one, then a counter is +1, close_cnt.
if close_cnt >= some quantity, (default 3), then a line will be drawn from that bar.
there are just 10 plots. so when the 11th count signal occurs, the 1st line stops and a new line starts.
linenum is a counter, that counts 1 to 10, then starts over at 1.
this controls the sequencing through the 10 plots.
Code:
# daily_prices_compare_to_near_00
#https://usethinkscript.com/threads/support-and-resistance-based-on-h-l-o-c-of-daily-candle.15492/
#Support and Resistance Based on H, L, O, C of Daily Candle
def na = double.nan;
def bn = barnumber();
def lastbn = HighestAll(If(IsNaN(close), 0, bn));
def lastbar = if (bn == lastbn) then 1 else 0;
#def lastbar = !isnan(close[0]) and isnan(close[-1]);
#def barsleft = lastbn - bn + 1;
def barsleft = lastbn - bn + 0;
#---------------------------
input bars = 250;
def rng = (!isnan(close) and isnan(close[-bars]));
def rng_start = (!isnan(close[-(bars-1)]) and isnan(close[-(bars+0)]));
input test_start_line = yes;
addverticalline(test_start_line and rng_start, "start", color.cyan);
#---------------------------
input near_per = 0.01;
#input near_per = 0.05;
input min_qty_to_match = 3;
addlabel(1, " ", color.black);
addlabel(1, min_qty_to_match + " min qty of occurances of a price", color.yellow);
# check close price to future close prices
def close_cnt = if barsleft >= bars then 0
else fold i1 = 1 to bars+1
with p1
while !isnan(getvalue(close, -i1))
do p1 + if ((close + near_per) >= getvalue(close, -i1) and (close - near_per) <= getvalue(close, -i1)) then 1 else 0;
def cls_en = if close_cnt >= min_qty_to_match then 1 else 0;
# count bars with enough counts
def count_close_en;
if bn == 1 then {
count_close_en = 0;
} else if rng_start then {
count_close_en = fold i2 = 1 to bars+1
with p2
while !isnan(getvalue(close, -i2))
do p2 + if (getvalue(cls_en, -i2)) then 1 else 0;
} else {
count_close_en = count_close_en[1];
}
addlabel(1, " ", color.black);
addlabel(1,
count_close_en + " quantity of bar closes with more than " + min_qty_to_match + " occurances"
, color.yellow);
input test2_count = yes;
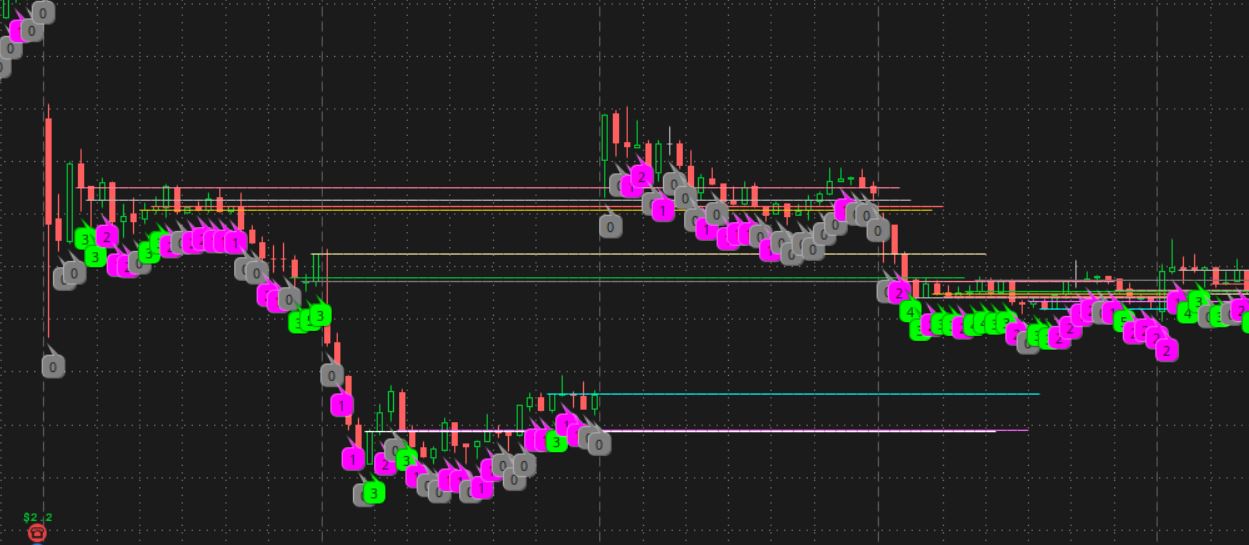
addchartbubble(test2_count, low*0.999,
close_cnt + "\n"
, (if cls_en then color.green else if close_cnt > 0 then color.magenta else color.gray), no);
def lineqty = 10;
def cnt;
def linenum;
#def seq;
if bn == 1 then {
cnt = 0;
linenum = 0;
} else if cls_en then {
cnt = cnt[1] + 1;
linenum = if cnt % lineqty == 0 then lineqty else cnt % lineqty;
} else {
cnt = cnt[1];
linenum = linenum[1];
}
# plot 10 lines
def l1 = if linenum[1] != 1 and linenum == 1 then close else l1[1];
def l2 = if linenum[1] != 2 and linenum == 2 then close else l2[1];
def l3 = if linenum[1] != 3 and linenum == 3 then close else l3[1];
def l4 = if linenum[1] != 4 and linenum == 4 then close else l4[1];
def l5 = if linenum[1] != 5 and linenum == 5 then close else l5[1];
def l6 = if linenum[1] != 6 and linenum == 6 then close else l6[1];
def l7 = if linenum[1] != 7 and linenum == 7 then close else l7[1];
def l8 = if linenum[1] != 8 and linenum == 8 then close else l8[1];
def l9 = if linenum[1] != 9 and linenum == 9 then close else l9[1];
def l10 = if linenum[1] != 10 and linenum == 10 then close else l10[1];
plot z1 = if l1 == 0 or isnan(close) then na else l1;
plot z2 = if l2 == 0 or isnan(close) then na else l2;
plot z3 = if l3 == 0 or isnan(close) then na else l3;
plot z4 = if l4 == 0 or isnan(close) then na else l4;
plot z5 = if l5 == 0 or isnan(close) then na else l5;
plot z6 = if l6 == 0 or isnan(close) then na else l6;
plot z7 = if l7 == 0 or isnan(close) then na else l7;
plot z8 = if l8 == 0 or isnan(close) then na else l8;
plot z9 = if l9 == 0 or isnan(close) then na else l9;
plot z10 = if l10 == 0 or isnan(close) then na else l10;
z1.SetPaintingStrategy(PaintingStrategy.HORIZONTAL);
z2.SetPaintingStrategy(PaintingStrategy.HORIZONTAL);
z3.SetPaintingStrategy(PaintingStrategy.HORIZONTAL);
z4.SetPaintingStrategy(PaintingStrategy.HORIZONTAL);
z5.SetPaintingStrategy(PaintingStrategy.HORIZONTAL);
z6.SetPaintingStrategy(PaintingStrategy.HORIZONTAL);
z7.SetPaintingStrategy(PaintingStrategy.HORIZONTAL);
z8.SetPaintingStrategy(PaintingStrategy.HORIZONTAL);
z9.SetPaintingStrategy(PaintingStrategy.HORIZONTAL);
z10.SetPaintingStrategy(PaintingStrategy.HORIZONTAL);
input test3 = no;
addchartbubble(test3, low*0.999,
close_cnt + "\n" +
cnt + "\n" +
linenum
, (if cls_en then color.green else if close_cnt > 0 then color.magenta else color.gray), no);
#----------------------
input test1 = no;
addchartbubble(test1, low,
bn + "\n" +
barsleft
, color.yellow, no);
input test_vert_lines = no;
addverticalline(test_vert_lines and rng, "-");
#
lines from close prices, that are near at least 3 future close prices
a bubble shows the quantity
--------------------
an alternative is to do a profile of the prices.
here is my version of a profile, that looks at 40 price groups, spanning the prices on the chart. so the % tolerance couold vary quite a bit. and to get a smaller %, would require a lot more than 40 sets of formulas.
Tradingview Poor man's volume profile
post14
https://usethinkscript.com/threads/tradingview-poor-mans-volume-profile.14460/#post-119999