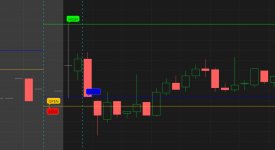
#ohlc_lines_from_time_period

#https://usethinkscript.com/threads/daily-4hr-ohlc-6am-to-10am.21619/
#Daily 4hr OHLC - 6am to 10am
#chris_dc  10/9

# mark the daily 4hr candle,
#  from 6am - 10am pst
#   with the OHLC lines
#    and the lines stay there until 9:59am of the next day
#     then the new levels would be marked out.

# options:
#   the previous levels stay on the graph  or only show the most recent one


def na = double.nan;
def bn = barnumber();

input start = 0600;
input end = 1000;
#def daytime = if secondsfromTime(start) >= 0 and secondstillTime(end) > 0 then 1 else 0;

def period = (secondsfromTime(start) >= 0 and secondstillTime(end) > 0);

def n = 800;
def big = 99999;

def o;
def h;
def l;
def c;
def cnt;
if bn == 1 then {
 o = na;
 h = na;
 l = na;
 c = na;
 cnt = 0;
} else if (!period[1] and period) then {
# 1st bar of period, find price levels
o = open;

h = fold a2 = 0 to n
  with b2
  while getvalue(period, -a2)
  do max(b2, getvalue(high, -a2));

l = fold a3 = 0 to n
  with b3 = big
  while getvalue(period, -a3)
  do min(b3, getvalue(low, -a3));

c = fold a4 = 0 to n
  with b4 = big
  while getvalue(period, -a4)
  do getvalue(close, -a4);

cnt = cnt[1] + 1;

} else {
o = o[1];
h = h[1];
l = l[1];
c = c[1];
cnt = cnt[1];
}

input only_last_period = yes;
def cnthi = highestall(cnt);
def last = (only_last_period and cnthi == cnt);

def lines = if !only_last_period then 1
 else if last then 1
 else 0;


plot zo = if lines then o else na;
plot zh = if lines then h else na;
plot zl = if lines then l else na;
plot zc = if lines then c else na;

zo.SetPaintingStrategy(PaintingStrategy.HORIZONTAL);
zh.SetPaintingStrategy(PaintingStrategy.HORIZONTAL);
zl.SetPaintingStrategy(PaintingStrategy.HORIZONTAL);
zc.SetPaintingStrategy(PaintingStrategy.HORIZONTAL);

zo.SetDefaultColor(Color.orange);
zh.SetDefaultColor(Color.green);
zl.SetDefaultColor(Color.red);
zc.SetDefaultColor(Color.blue);


# bubbles , line labels
def bubble_off = 0;

addchartbubble(
(lines and period[bubble_off] and open[bubble_off] == o),
o,
"OPEN",
zo.TakeValueColor(),
(if close > open then no else yes)
);

addchartbubble(
(lines and period[bubble_off] and high[bubble_off] == h),
h,
"HIGH",
zh.TakeValueColor(),
yes
);


addchartbubble(
(lines and period[bubble_off] and low[bubble_off] == l),
l,
"LOW",
zl.TakeValueColor(),
no
);


addchartbubble(
(lines and period[bubble_off] and close[bubble_off] == c),
c,
"CLOSE",
zc.TakeValueColor(),
(if close > open then no else yes)
);


input show_start_stop_vert_lines = yes;
addverticalline(show_start_stop_vert_lines and (!period[1] and period), "-", color.cyan);
addverticalline(show_start_stop_vert_lines and (period and !period[-1]), "-", color.cyan);


# ----------------------------
# test stuff

#addchartbubble(1, low, c, color.yellow,no);
#addverticalline(period, "-");

#addverticalline((!period[1] and period), "first", color.yellow);


addchartbubble(
0, low,
lines + "\n" +
period[bubble_off] + "\n" +
(open[bubble_off] == o) + "\n"
, color.cyan, no);
#


