
Author Message:
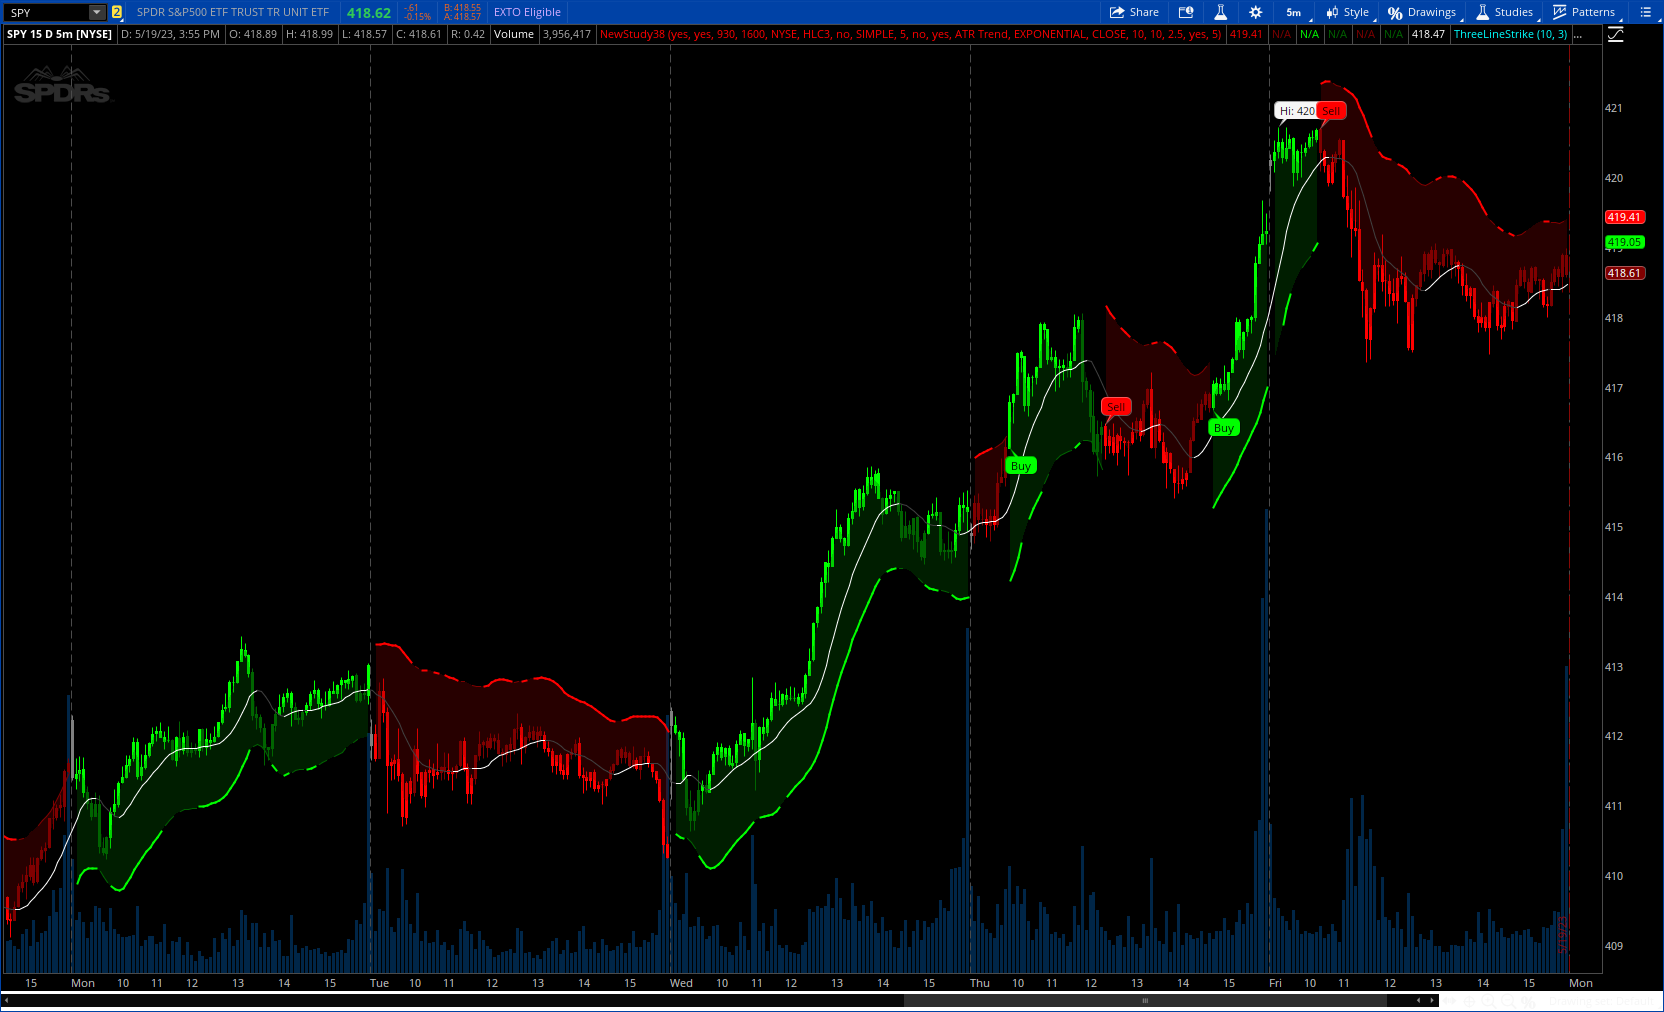
Cumulative TICK Trend indicator is a comprehensive trading tool that uses TICK data to define the market's cumulative trend. Trend is shown on ATR EMA bands (I added Bollinger band as well), which is overlaid on the price chart.
How it Works:
This indicator accumulates TICK data during market hours (9:30-16:00) as per the New York time zone and resets at the start of a new session or the end of the regular session. This cumulative TICK value is then used to determine the trend.
The trend is defined as bullish if the SMA of cumulative TICK is equal to or greater than zero and bearish if it's less than zero. Additionally, this indicator plots the ATR bands, which can be used as volatility measures. The Upper ATR Band and Lower ATR Band (I added Bollinger band as well), can be made smoother using the SMA, according to the trader's preference.
The plot includes two parts for each trend: a stronger color (Red for bear, Green for bull) when the trend is ongoing, and a lighter color when the trend seems to be changing.
Remember, this tool is intended to be used as part of a comprehensive trading strategy. Always ensure you are managing risk appropriately and consulting various data sources to make informed trading decisions.
CODE:
CSS:
#// This source code is subject to the terms of the Mozilla Public License 2.0 at https://mozilla.org/MPL/2.0/
#// © PtGambler
#indicator(title='Cumulative TICK Trend[Pt]', shorttitle='CumTICK-trend[Pt]', overlay=true)
# Converted and mod by Sam4Cok@Samer800    - 05/2023
input BarColor   = yes;
input ShowSignals = no;
input startTime  = 0930;
input endTime    = 1600;
input tick_src = {default NYSE, NASDAQ, "S&P 500","DOW Jones", "Russel 2000", AMEX, ARCA, "All US"};
input TickSource = {"Close", "Open", "High", "Low", "HL2", "OHLC4",Default "HLC3"};
input CumulativeTickSmoothing = no;    # "Apply Cum TICK Smoothing"
input SmoothingType = AverageType.SIMPLE;
input CumTickSmoothingLength = 5;      # Cum TICK Smoothing Length
input show_Band = no;        # 'Show Bands'
input ShowMidLine = yes;
input CalcMethod = {Default "ATR Trend","Bollinger Trend"};
input BandMovAvgType = AverageType.EXPONENTIAL;
input Source = close;         # 'Source'
input atrPeriod  = 10;        # 'ATR Period'
input BandPeriod = 10;        # 'EMA Period'
input Multiplier = 3.0;       # 'Multiplier'
input smoothBand = yes;       # 'Smooth Band'
input smoothBandLength = 5;   # 'Smoothing Length'

def na = Double.NaN;
def last = IsNaN(close);
def current = GetAggregationPeriod();
def intraDay = current < AggregationPeriod.DAY;
def t1 = SecondsTillTime(startTime) < 0 and SEcondsTillTime(endTime) > 0;
def atrTrend = CalcMethod==CalcMethod."ATR Trend";

#--- Color
DefineGlobalColor("up", Color.GREEN);
DefineGlobalColor("dup", Color.DARK_GREEN);
DefineGlobalColor("dn", Color.RED);
DefineGlobalColor("ddn",Color.DARK_RED);
#---
def tickH;
def tickL;
def tickO;
def tickC;
def tickHL2;
def tickOHLC4;
def tickHLC3;

switch (tick_src) {
case NASDAQ:
    tickH     = High (symbol= "$TICK/Q");
    tickL     = Low  (symbol= "$TICK/Q");
    tickO     = Open (symbol= "$TICK/Q");
    tickC     = Close(symbol= "$TICK/Q");
    tickHL2   = HL2  (symbol= "$TICK/Q");
    tickOHLC4 = OHLC4(symbol= "$TICK/Q");
    tickHLC3  = HLC3 (symbol= "$TICK/Q");
case NYSE:
    tickH     = High (symbol= "$TICK");
    tickL     = Low  (symbol= "$TICK");
    tickO     = Open (symbol= "$TICK");
    tickC     = Close(symbol= "$TICK");
    tickHL2   = HL2  (symbol= "$TICK");
    tickOHLC4 = OHLC4(symbol= "$TICK");
    tickHLC3  = HLC3 (symbol= "$TICK");
case "Russel 2000":
    tickH     = High (symbol= "$TIKRL");
    tickL     = Low  (symbol= "$TIKRL");
    tickO     = Open (symbol= "$TIKRL");
    tickC     = Close(symbol= "$TIKRL");
    tickHL2   = HL2  (symbol= "$TIKRL");
    tickOHLC4 = OHLC4(symbol= "$TIKRL");
    tickHLC3  = HLC3 (symbol= "$TIKRL");
case "S&P 500":
    tickH     = High (symbol= "$TIKSP");
    tickL     = Low  (symbol= "$TIKSP");
    tickO     = Open (symbol= "$TIKSP");
    tickC     = Close(symbol= "$TIKSP");
    tickHL2   = HL2  (symbol= "$TIKSP");
    tickOHLC4 = OHLC4(symbol= "$TIKSP");
    tickHLC3  = HLC3 (symbol= "$TIKSP");
case "DOW Jones":
    tickH     = High (symbol= "$TIKI");
    tickL     = Low  (symbol= "$TIKI");
    tickO     = Open (symbol= "$TIKI");
    tickC     = Close(symbol= "$TIKI");
    tickHL2   = HL2  (symbol= "$TIKI");
    tickOHLC4 = OHLC4(symbol= "$TIKI");
    tickHLC3  = HLC3 (symbol= "$TIKI");
case "All US":
    tickH     = High (symbol= "$TIKUS");
    tickL     = Low  (symbol= "$TIKUS");
    tickO     = Open (symbol= "$TIKUS");
    tickC     = Close(symbol= "$TIKUS");
    tickHL2   = HL2  (symbol= "$TIKUS");
    tickOHLC4 = OHLC4(symbol= "$TIKUS");
    tickHLC3  = HLC3 (symbol= "$TIKUS");
case AMEX:
    tickH     = High (symbol= "$TICKA");
    tickL     = Low  (symbol= "$TICKA");
    tickO     = Open (symbol= "$TICKA");
    tickC     = Close(symbol= "$TICKA");
    tickHL2   = HL2  (symbol= "$TICKA");
    tickOHLC4 = OHLC4(symbol= "$TICKA");
    tickHLC3  = HLC3 (symbol= "$TICKA");
case ARCA:
    tickH     = High (symbol= "$TICKAR");
    tickL     = Low  (symbol= "$TICKAR");
    tickO     = Open (symbol= "$TICKAR");
    tickC     = Close(symbol= "$TICKAR");
    tickHL2   = HL2  (symbol= "$TICKAR");
    tickOHLC4 = OHLC4(symbol= "$TICKAR");
    tickHLC3  = HLC3 (symbol= "$TICKAR");
}
def cumTICK_src;
switch (TickSource) {
case High:
    cumTICK_src = tickH;
case Low:
    cumTICK_src = tickL;
case Close:
    cumTICK_src = tickC;
case Open:
    cumTICK_src = tickO;
case hl2:
    cumTICK_src = tickHL2;
case ohlc4:
    cumTICK_src = tickOHLC4;
case hlc3:
    cumTICK_src = tickHLC3;
}
#// Calculation - Cumulative TICK ----

def cumTICK;

if !t1 or last {
    cumTICK = 0;
    } else {
    cumTICK =  cumTICK[1] + cumTICK_src;#cumTICK_;
}

def cumTICK_ma = if CumulativeTickSmoothing then MovingAverage(SmoothingType, cumTICK, CumTickSmoothingLength) else cumTICK;

def bull_trend = cumTICK_ma >= 0;
def bear_trend = cumTICK_ma < 0;

#// ATR Band --------

def nATR = ATR(LENGTH = atrPeriod);
def bbup = MovingAverage(BandMovAvgType, high,BandPeriod) + stdev(high,BandPeriod) * Multiplier;
def bbdn = MovingAverage(BandMovAvgType, low,BandPeriod)  - stdev(low,BandPeriod) * Multiplier;
def atrup = Source + nATR * Multiplier;
def atrdn = Source - nATR * Multiplier;
def up = if atrTrend then atrup else bbup;
def dn = if atrTrend then atrdn else bbdn;
def up_ma_   = MovingAverage(BandMovAvgType, up, BandPeriod);
def down_ma_ = MovingAverage(BandMovAvgType, dn, BandPeriod);

def up_ma;
def down_ma;
if smoothBand {
    up_ma = MovingAverage(SmoothingType, up_ma_, smoothBandLength);
    down_ma = MovingAverage(SmoothingType, down_ma_, smoothBandLength);
} else {
    up_ma = up_ma_;
    down_ma = down_ma_;
}
def mid_ma = (up_ma + down_ma) / 2;
#// Plotting

plot BearTrend = if !intraDay then up_ma else
                 if t1 and bear_trend and cumTICK_ma <= cumTICK_ma[1] then up_ma else na;    # 'Bear Trend'
BearTrend.SetLineWeight(2);
BearTrend.SetDefaultColor(GlobalColor("dn"));

plot BearTrend_ = if t1 and bear_trend and cumTICK_ma > cumTICK_ma[1] then up_ma else na;    # 'Bear Trend'
BearTrend_.SetDefaultColor(GlobalColor("ddn"));

plot BullTrend = if !intraDay then down_ma else
                if t1 and bull_trend and cumTICK_ma >= cumTICK_ma[1]  then down_ma else na; # 'Bull Trend'
BullTrend.SetLineWeight(2);
BullTrend.SetDefaultColor(GlobalColor("up"));

plot BullTrend_ = if t1 and bull_trend and cumTICK_ma < cumTICK_ma[1] then down_ma else na;  # 'Bull Trend'
BullTrend_.SetDefaultColor(GlobalColor("dup"));

plot UpperATR = if show_Band then up_ma else na;      # 'Upper ATR'
plot LowerATR = if show_Band then down_ma else na;    # 'Lower ATR'
UpperATR.SetDefaultColor(GlobalColor("ddn"));
LowerATR.SetDefaultColor(GlobalColor("dup"));

plot midLine = if ShowMidLine then mid_ma else na;
midLine.AssignValueColor(if mid_ma>mid_ma[1] then Color.WHITE else Color.DARK_GRAY);
#midLine.SetStyle(Curve.SHORT_DASH);

def midBar = OHLC4;
def BearBand = !isNaN(BearTrend) or !isNaN(BearTrend_);
def BullBand = !isNaN(BullTrend) or !isNaN(BullTrend_);
AddCloud(if BearBand then up_ma else na, midBar, Color.DARK_RED, Color.DARK_RED);
AddCloud(if BullBand then midBar else na, down_ma, Color.DARK_GREEN, Color.DARK_GREEN);

#-- Signal
def SigUp = t1[1] and BullBand and !BullBand[1];
def SigDn = t1[1] and BearBand and !BearBand[1];

AddChartBubble(ShowSignals and SigUp, low, "Buy", Color.GREEN, no);
AddChartBubble(ShowSignals and SigDn, high, "Sell", Color.REd, yes);

#-- Bar Color
def ExtUp = Source>mid_ma and BullBand;
def UpBar = BullBand;
def ExtDn = Source<mid_ma and BearBand;
def DnBar = BearBand;

AssignPriceColor(if !BarColor or !intraDay then Color.CURRENT else
                 if ExtUp then Color.GREEN else
                 if UpBar then Color.DARK_GREEN else
                 if ExtDn then Color.RED else
                 if DnBar then Color.DARK_RED else Color.GRAY);


# --- END CODE