
Rich-Trader
New member
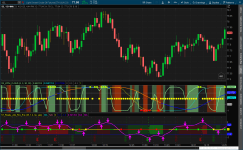
I am trying to create a momentum bar similar to the bar on ST ready aim fire just with my parameters which are nothing to do with RAF. When I create it I can get the squares to plot but not at zero line I see why just don't know how to fix it. I am wanting all squares to plot on zero line. Any help would be appreciated.
Here is full code
#// author Rich Darnell
#// creator John EHLERS
#indicator('MKT SS Ver2', shorttitle='SS Ver2')
#// Define the first stochastic plot
declare lower;
input stochlength = 5;#, 'STOCH Length')
input wmalength = 5;#, title='Smoothing length')
input stochlength2 = 30;#, 'STOCH Length 2')
input wmalength2 = 30;#, title='Smoothing length 2')
def last = isNaN(close);
def na = Double.NaN;
def pos = Double.POSITIVE_INFINITY;
def neg = Double.NEGATIVE_INFINITY;
# stoch(source, high, low, length) =>
script stoch {
input src = close;
input h = high;
input l = low;
input len = 0;
def stoch = 100 * (src - lowest(l, len)) / (highest(h, len) - lowest(l, len));
plot return = stoch;
}
def v1 = 0.1 * (stoch(close, high, low, stochlength) - 50);
def v2 = WMA(v1, wmalength);
def INV = (Exp(2 * v2) - 1) / (Exp(2 * v2) + 1);
#// Determine the direction of the first stochastic plot
def dir = if v1 > v2 then 1 else
if v1 < v2 then -1 else 0;
#// Define the colors for the first stochastic plot
#// Plot the first stochastic plot and its smoothing line
plot firstStoc = INV;#, color=c1, linewidth=2)
firstStoc.SetLineWeight(2);
firstStoc.AssignValueColor(if dir==1 then Color.LIGHT_GREEN else
if dir==-1 then Color.LIGHT_GREEN else Color.BLUE);
plot wma1Line = WMA(INV, wmalength);#, color=dir == 1 ? color.green : color.red, linewidth=1)
wma1Line.AssignValueColor(if dir == 1 then color.DARK_GREEN else color.DARK_RED);
#// Define parameters for the second stochastic plot
def v3 = 0.1 * (stoch(close, high, low, stochlength2) - 50);
def v4 = WMA(v3, wmalength2);
def INV2 = (Exp(2 * v4) - 1) / (Exp(2 * v4) + 1);
#// Determine the direction of the second stochastic plot
def dir2 = if v3 > v4 then 1 else
if v3 < v4 then -1 else 0;
#// Define the colors for the second stochastic plot
#c2 = dir2 == 1 ? color.green : dir2 == -1 ? color.red : color.blue
#// Plot the second stochastic plot and its smoothing line
plot SecondStoc = INV2;#, color=c2, linewidth=2)
SecondStoc.SetLineWeight(2);
SecondStoc.AssignValueColor(if dir2==1 then Color.CYAN else
if dir2==-1 then Color.YELLOW else Color.GRAY);
plot wma2Line = WMA(INV2, wmalength2);#, color=dir2 == 1 ? color.green : color.red, linewidth=1)
wma2Line.AssignValueColor(if dir2 == 1 then color.BLUE else color.DARK_ORANGE);
#// Plot the background color for the trigger bar V1
AddCloud(if dir > 0 and v1 > 0.5 then pos else if dir < 0 and v1 < -0.5 then neg else na,
if dir > 0 and v1 > 0.5 then neg else if dir < 0 and v1 < -0.5 then pos else na, Color.LIGHT_GREEN, Color.LIGHT_RED);
#// Plot the background color for the trigger bar V3
AddCloud(if dir > 0 and v3 > 0.5 then pos else if dir < 0 and v3 < -0.5 then neg else na,
if dir > 0 and v3 > 0.5 then neg else if dir < 0 and v3 < -0.5 then pos else na, Color.LIGHT_GREEN, Color.LIGHT_RED);
plot hline0 = if last then na else 0;#, color=color.gray)
plot hline1 = if last then na else 0.5;#, color=color.red)
plot hline2 = if last then na else -0.5;#, color=color.green)
hline0.SetStyle(Curve.SHORT_DASH);
hline0.SetDefaultColor(Color.GRAY);
hline1.SetDefaultColor(Color.GRAY);
hline2.SetDefaultColor(Color.GRAY);
#// Plot Momentun Bar
def ema5 = ExpAverage(close, 5);
def ema21 = ExpAverage(close, 21);
def ema55 = ExpAverage(close, 55);
def cci = CCI();
def macd = MACD();
def bullish = ema5 > ema21 and ema21 > ema55 and cci > 100 and macd > 0;
def bearish = ema5 < ema21 and ema21 < ema55 and cci < -100 and macd < 0;
def neutral = !bullish and !bearish;
def signal = if bullish then 1 else if bearish then -1 else 0;
plot signalPlot = signal;
signalPlot.AssignValueColor(if signal == 1 then Color.LIME else if signal == -1 then Color.RED else Color.YELLOW);
signalPlot.SetPaintingStrategy(PaintingStrategy.SQUARES);
signalPlot.SetLineWeight(5);
signalPlot.SetDefaultColor(Color.YELLOW);
https%3A//i.imgur.com/EKjlmvX.png[/img]']

Here is full code
#// author Rich Darnell
#// creator John EHLERS
#indicator('MKT SS Ver2', shorttitle='SS Ver2')
#// Define the first stochastic plot
declare lower;
input stochlength = 5;#, 'STOCH Length')
input wmalength = 5;#, title='Smoothing length')
input stochlength2 = 30;#, 'STOCH Length 2')
input wmalength2 = 30;#, title='Smoothing length 2')
def last = isNaN(close);
def na = Double.NaN;
def pos = Double.POSITIVE_INFINITY;
def neg = Double.NEGATIVE_INFINITY;
# stoch(source, high, low, length) =>
script stoch {
input src = close;
input h = high;
input l = low;
input len = 0;
def stoch = 100 * (src - lowest(l, len)) / (highest(h, len) - lowest(l, len));
plot return = stoch;
}
def v1 = 0.1 * (stoch(close, high, low, stochlength) - 50);
def v2 = WMA(v1, wmalength);
def INV = (Exp(2 * v2) - 1) / (Exp(2 * v2) + 1);
#// Determine the direction of the first stochastic plot
def dir = if v1 > v2 then 1 else
if v1 < v2 then -1 else 0;
#// Define the colors for the first stochastic plot
#// Plot the first stochastic plot and its smoothing line
plot firstStoc = INV;#, color=c1, linewidth=2)
firstStoc.SetLineWeight(2);
firstStoc.AssignValueColor(if dir==1 then Color.LIGHT_GREEN else
if dir==-1 then Color.LIGHT_GREEN else Color.BLUE);
plot wma1Line = WMA(INV, wmalength);#, color=dir == 1 ? color.green : color.red, linewidth=1)
wma1Line.AssignValueColor(if dir == 1 then color.DARK_GREEN else color.DARK_RED);
#// Define parameters for the second stochastic plot
def v3 = 0.1 * (stoch(close, high, low, stochlength2) - 50);
def v4 = WMA(v3, wmalength2);
def INV2 = (Exp(2 * v4) - 1) / (Exp(2 * v4) + 1);
#// Determine the direction of the second stochastic plot
def dir2 = if v3 > v4 then 1 else
if v3 < v4 then -1 else 0;
#// Define the colors for the second stochastic plot
#c2 = dir2 == 1 ? color.green : dir2 == -1 ? color.red : color.blue
#// Plot the second stochastic plot and its smoothing line
plot SecondStoc = INV2;#, color=c2, linewidth=2)
SecondStoc.SetLineWeight(2);
SecondStoc.AssignValueColor(if dir2==1 then Color.CYAN else
if dir2==-1 then Color.YELLOW else Color.GRAY);
plot wma2Line = WMA(INV2, wmalength2);#, color=dir2 == 1 ? color.green : color.red, linewidth=1)
wma2Line.AssignValueColor(if dir2 == 1 then color.BLUE else color.DARK_ORANGE);
#// Plot the background color for the trigger bar V1
AddCloud(if dir > 0 and v1 > 0.5 then pos else if dir < 0 and v1 < -0.5 then neg else na,
if dir > 0 and v1 > 0.5 then neg else if dir < 0 and v1 < -0.5 then pos else na, Color.LIGHT_GREEN, Color.LIGHT_RED);
#// Plot the background color for the trigger bar V3
AddCloud(if dir > 0 and v3 > 0.5 then pos else if dir < 0 and v3 < -0.5 then neg else na,
if dir > 0 and v3 > 0.5 then neg else if dir < 0 and v3 < -0.5 then pos else na, Color.LIGHT_GREEN, Color.LIGHT_RED);
plot hline0 = if last then na else 0;#, color=color.gray)
plot hline1 = if last then na else 0.5;#, color=color.red)
plot hline2 = if last then na else -0.5;#, color=color.green)
hline0.SetStyle(Curve.SHORT_DASH);
hline0.SetDefaultColor(Color.GRAY);
hline1.SetDefaultColor(Color.GRAY);
hline2.SetDefaultColor(Color.GRAY);
#// Plot Momentun Bar
def ema5 = ExpAverage(close, 5);
def ema21 = ExpAverage(close, 21);
def ema55 = ExpAverage(close, 55);
def cci = CCI();
def macd = MACD();
def bullish = ema5 > ema21 and ema21 > ema55 and cci > 100 and macd > 0;
def bearish = ema5 < ema21 and ema21 < ema55 and cci < -100 and macd < 0;
def neutral = !bullish and !bearish;
def signal = if bullish then 1 else if bearish then -1 else 0;
plot signalPlot = signal;
signalPlot.AssignValueColor(if signal == 1 then Color.LIME else if signal == -1 then Color.RED else Color.YELLOW);
signalPlot.SetPaintingStrategy(PaintingStrategy.SQUARES);
signalPlot.SetLineWeight(5);
signalPlot.SetDefaultColor(Color.YELLOW);
Code:
https://imgur.com/EKjlmvX
Code:
[ATTACH=full]18462[/ATTACH]Attachments
Last edited: