Countdown Clock to bar close in ThinkorSwim?

anycolour

Member
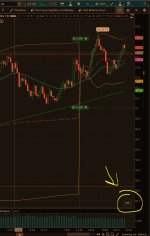
Hey guys. I've been using tick charts and I like that it tells you how many ticks have passed in the formation of a new 1k tick candle (you can count how many are left until a new candle forms). In the attached screenshot, it says 960, that means 960 trades/ticks have been made in that candle (meaning 40 remain to fully form that candle, and then a new candle will be formed with another 1k ticks/trades).

I want to do that with the 5m chart (time chart, not tick).
Is there an indicator that could tell me the remaining minutes and seconds until the formation of a new 5m candle? A countdown for the formation of 5 minute candles. Thank you!

bUTSDS9.jpg
 

Attachments

  • bUTSDS9.jpg
    bUTSDS9.jpg
    82.1 KB · Views: 594
Last edited by a moderator:
The only times which are accessible to thinkScript occur at the exact millisecond that a bar begins. Using a five minute chart as the example, there is going to be a 9:30 bar, 9:35 bar, 9:40 bar, etc. These are the only times, in this particular case, that thinkScript can recognize. Basically, in Real Time, from 9:30:00 to 9:34:59.999 it remains as 9:30 in thinkScript Time. The types of bar count-down timers people tend to ask for are simply not possible in thinkScript. There are some very awkward work-arounds, but they aren't worth it. You're honestly better off just using the regular clock at the top of tos.
 
Last edited:
Hey guys. I've been using tick charts and I like that it tells you how many ticks have passed in the formation of a new 1k tick candle (you can count how many are left until a new candle forms). In the attached screenshot, it says 960, that means 960 trades/ticks have been made in that candle (meaning 40 remain to fully form that candle, and then a new candle will be formed with another 1k ticks/trades).

I want to do that with the 5m chart (time chart, not tick).
Is there an indicator that could tell me the remaining minutes and seconds until the formation of a new 5m candle? A countdown for the formation of 5 minute candles. Thank you!

bUTSDS9.jpg
I just added seconds to the taskbar clock so it shows when the clock is about to strike the next full minute. As soon as the clock is about seconds out I get ready to enter the trade on the confirmation bar right before the closing bar closes or the confirmation bar opens. If the confirmation bar opens lower, you can choose to exit or stay in the trade. Works pretty good because I keep my task bar present on all screens. This keeps me from having to keep the main ToS window on screen if I want to keep a different chart or something up in its place. This link provides step by step instructions on how to change the settings on the Windows taskbar clock to include seconds: https://www.howtogeek.com/325096/how-to-make-windows-10s-taskbar-clock-display-seconds/
 
HI, I am looking for a "count down" indicator that has a label in the corner that will show the minutes & seconds remaining in the candle. Example: At the start of a 5 minute candle the label would show 5 minute 0 seconds and count down from there. Thanks in advance
 
Timer alert - might be helpful
Ruby:
input Interval_In_Minutes = 15;
def MinutesGoneBy = SecondsFromTime(15) / 60;
def IntervalPast = Round(((MinutesGoneBy / Interval_In_Minutes) / 100));
def IntervalGoneBy = if IntervalPast > IntervalPast[1] then 1 else 0;
Alert(IntervalGoneBy == 1, " ", Alert.BAR, Sound.Chimes);
 
Last edited by a moderator:
Hello community traders . Can you help me find a candel minute timer. CUSTOM JOB So i can see the price and time left on the clock at the same time. Thinkorswim clock top left to small . TIMER ON THE CANDLESSTICK WOULD BE BETTER IN THE CHART . Hope there is a Script for this thanks . Scott
 
I was only able to display the time on a new bar per time frame, doest anyone know how to format the year?

Code:
input ShowTime = yes;
input TimeZone = 10.5;
def Hours = Floor(TimeZone + SecondsFromTime(0930) / 60 / 60) - 1;
def Minutes = ((TimeZone + SecondsFromTime(930) / 60 / 60) % 1) * 60;
AddLabel(ShowTime, "Market Time:  " + GetDayOfMonth(GetYYYYMMDD()) + "/" + GetMonth() + "/"  +(GetYear())  + ":" + Hours + ":" + Minutes ,
             if !IsNaN(GetTime())
             then Color.LIME
             else if IsNaN(GetTime())
                  then Color.PINK
                  else Color.WHITE);

This might help

Code:
input ShowTime = yes;
input TimeZone = 10.5;
def Hours = Floor(TimeZone + SecondsFromTime(0930) / 60 / 60) - 1;
def Minutes = ((TimeZone + SecondsFromTime(930) / 60 / 60) % 1) * 60;
AddLabel(ShowTime, "Market Time:  " + GetDayOfMonth(GetYYYYMMDD()) + "/" + GetMonth() + "/"  + asprice(GetYear())  + ": " + Hours + ":" + Minutes ,
             if !IsNaN(GetTime())
             then Color.LIME
             else if IsNaN(GetTime())
                  then Color.PINK
                  else Color.WHITE);
 
add the 1 minute display count


I am trying to add the 1 minute display count on the last current candle from my chart but I am getting the error on this line

def bars = BarNumber() - HighestAll(if SecondsFromTime(0) < 60, BarNumber());

Here is my script that I am working on:

input aggregationPeriod = AggregationPeriod.MIN;

def bars = BarNumber() - HighestAll(if SecondsFromTime(0) < 60, BarNumber());

plot count = if GetAggregationPeriod() == aggregationPeriod then bars else Double.NaN;
count.SetPaintingStrategy(PaintingStrategy.VALUES_ABOVE);
count.AssignValueColor(Color.WHITE);

Anyone can see if there is anything wrong with the script?
 
Last edited by a moderator:
Hi all,


I am trying to add the 1 minute display count on the last current candle from my chart but I am getting the error on this line

def bars = BarNumber() - HighestAll(if SecondsFromTime(0) < 60, BarNumber());

Here is my script that I am working on:

input aggregationPeriod = AggregationPeriod.MIN;

def bars = BarNumber() - HighestAll(if SecondsFromTime(0) < 60, BarNumber());

plot count = if GetAggregationPeriod() == aggregationPeriod then bars else Double.NaN;
count.SetPaintingStrategy(PaintingStrategy.VALUES_ABOVE);
count.AssignValueColor(Color.WHITE);

Anyone can see if there is anything wrong with the script?

several issues,

the 'if then' inside of the highestall( ), is missing the 3rd parameter, the 'else' part, the false part.


if SecondsFromTime(0) < 60,
this will never be true. The smallest time increment is one minute or 60 seconds, so there will not be any values less than 60.
if it were possible for it to be true, then it would be
BarNumber() - BarNumber()
which is 0


i have no idea what you are trying to do, please elaborate.
what does this mean?
.. 1 minute display count
display what?
count what?
 

Join useThinkScript to post your question to a community of 21,000+ developers and traders.

Similar threads

Not the exact question you're looking for?

Start a new thread and receive assistance from our community.

87k+ Posts
291 Online
Create Post

Similar threads

Similar threads

The Market Trading Game Changer

Join 2,500+ subscribers inside the useThinkScript VIP Membership Club
  • Exclusive indicators
  • Proven strategies & setups
  • Private Discord community
  • ‘Buy The Dip’ signal alerts
  • Exclusive members-only content
  • Add-ons and resources
  • 1 full year of unlimited support

Frequently Asked Questions

What is useThinkScript?

useThinkScript is the #1 community of stock market investors using indicators and other tools to power their trading strategies. Traders of all skill levels use our forums to learn about scripting and indicators, help each other, and discover new ways to gain an edge in the markets.

How do I get started?

We get it. Our forum can be intimidating, if not overwhelming. With thousands of topics, tens of thousands of posts, our community has created an incredibly deep knowledge base for stock traders. No one can ever exhaust every resource provided on our site.

If you are new, or just looking for guidance, here are some helpful links to get you started.

What are the benefits of VIP Membership?
VIP members get exclusive access to these proven and tested premium indicators: Buy the Dip, Advanced Market Moves 2.0, Take Profit, and Volatility Trading Range. In addition, VIP members get access to over 50 VIP-only custom indicators, add-ons, and strategies, private VIP-only forums, private Discord channel to discuss trades and strategies in real-time, customer support, trade alerts, and much more. Learn all about VIP membership here.
How can I access the premium indicators?
To access the premium indicators, which are plug and play ready, sign up for VIP membership here.
Back
Top