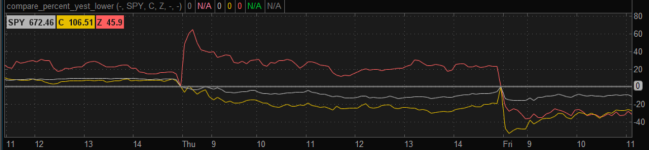
The source code for the COMPARISON study is not available. I have a chart for stocks that is simply the Haiken Ashi candles with a 7 period moving average that changes colors (green up, red down) I just want to be able to do a comparison with an index or ETF like SPY or QQQ, whereby those look similar to the tickers. I did work on thinkscript for quite a while to figure it out and I am missing something in the code.
This is my code for the color changing M.A. THIS code works fine for the tickers.
input Length = 7;
input AvgType = AverageType.SIMPLE;
input Price = Close;
plot Slope = MovingAverage(AvgType, Price, Length);
Slope.Definecolor("Positive",color.red);
Slope.Definecolor("Negative",color.green);
Slope.AssignValueColor(if Slope > Slope[1] then Slope.Color("Negative") else Slope.Color("Positive"));
Below is the script that I thought would work for the ETF's but not yet:
I need to some how include the Heiken Ashi type of chart.
input comparisonStyle = {"BAR", "LINE", default "CANDLE"};
input secondarySecurity = "";
declare lower;
input length = 7;
plot momentum = close - (length);
momentum.DefineColor("positive", Color.UPTICK);
momentum.DefineColor ("NEGATIVE", Color.DOWNTICK);
momentum.AssignValueColor(if momentum >= 0 then momentum.color.GREEN("POSITIVE") else momentum.Color.RED("NEGATIVE"))

I hope someone can come to my rescue and be a hero!! Thank you and I am happy to further discuss.
Thank you,
Stevep
This is my code for the color changing M.A. THIS code works fine for the tickers.
input Length = 7;
input AvgType = AverageType.SIMPLE;
input Price = Close;
plot Slope = MovingAverage(AvgType, Price, Length);
Slope.Definecolor("Positive",color.red);
Slope.Definecolor("Negative",color.green);
Slope.AssignValueColor(if Slope > Slope[1] then Slope.Color("Negative") else Slope.Color("Positive"));
Below is the script that I thought would work for the ETF's but not yet:
I need to some how include the Heiken Ashi type of chart.
input comparisonStyle = {"BAR", "LINE", default "CANDLE"};
input secondarySecurity = "";
declare lower;
input length = 7;
plot momentum = close - (length);
momentum.DefineColor("positive", Color.UPTICK);
momentum.DefineColor ("NEGATIVE", Color.DOWNTICK);
momentum.AssignValueColor(if momentum >= 0 then momentum.color.GREEN("POSITIVE") else momentum.Color.RED("NEGATIVE"))
I hope someone can come to my rescue and be a hero!! Thank you and I am happy to further discuss.
Thank you,
Stevep