Common support, resistance and key levels

tride

New member
Hi all

Drawing support, resistance and marking up other key levels on the charts are a pretty common thing that most of the traders end up doing. Volume, gap ups/down, multiple touch points, breakouts, etc. - a bunch of techniques are used to plot these and all of us have this plotted slightly here and there on the price marks.

Would be pretty cool if there was an indicator or service that would show me community collaborated price levels (& verified by some expert) on the chart, that way everyone would be able to leverage everyone's elses work and we wouldnt have to plot these individually, does anything like that exist? or could be made?
 
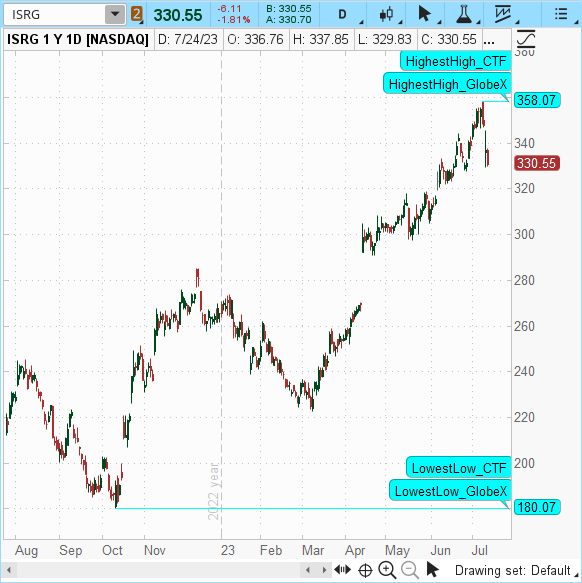
Here is a very nice Globex support/resistance script: https://tos.mx/JqbDgfJ
yC86NZA.png

Ruby:
## OneNote Archive Name: WIP_PickAPlotPlus_v03
## Suggested Tos Name using JQ naming convention: WIP_PickAPlotPlus_v03
## OneNote Section: Support Resistance
## Archive Date:
## Provenance: scripted and archived by JQ

## Archive, Usage or Lounge Notes:
    # Concept by JQ
    # Initialization and vastly superior logic by Nube...thank you!

 ## Drafting Notes:
    # 02.26.2019  Begin drafting
## End OneNote Archive Header

 declare upper;

# Universal Definitions using Padawan variable naming convention (JQ) v03.04.2019
# iData Definitions
    def vHigh = high;  # creates the variable vHigh.  Use of the variable reduce data calls to tos iData server
    def initHigh =  CompoundValue(1, high, high);  # creates and initialized variable for High
    def vLow = low;
    def initLow = CompoundValue(1, low, low);
    def vOpen = open;
    def initOpen = CompoundValue(1, open, open);
    def vClose = close;
    def initClose = CompoundValue(1, close, close);
    def vVolume = volume;
    def initVolume = CompoundValue(1, volume, volume);
    def nan = Double.NaN;

# Bar Definitions (Time & Date)
    def bn = BarNumber();
    def currentBar = HighestAll(if !IsNaN(vHigh) then bn else nan);
    def Today = GetDay() ==GetLastDay();
    def time = GetTime();
    def GlobeX = GetTime() < RegularTradingStart(GetYYYYMMDD());
    # def globeX_v2 = if time crosses below RegularTradingEnd(GetYYYYMMDD()) then bn else GlobeX[1];
    def RTS  = RegularTradingStart(GetYYYYMMDD());
    def RTE  = RegularTradingEnd(GetYYYYMMDD());
    def RTH = GetTime() > RegularTradingStart(GetYYYYMMDD());
    def RTH_v2 = if time crosses above RegularTradingStart(GetYYYYMMDD()) then bn else RTH[1];

# Bubble Locations
    def x_AxisLastExpansionBar = BarNumber() == HighestAll(BarNumber());  #corrected 11.12.2018 (JQ)
        # syntax: addChartBubble(x_AxisLastExpansionBar, y-axis coordinate," text", Color.LIME); #verified 12.25.2018 (JQ)

## Begin Globex Code
## Globex Highest High Code
## Inputs

input HighestHighGlobeX = {"Do Not Display",  "From High to Current Bar", default  "From High into Expansion Area", "Entire Chart Time Frame"};

#input "Highest High Test" = "the manual states this should function properly";
#addlabel(1,"Highest High Test",color.white);
## Definitions (specific to Globex script)

def iterHighestPrice_GlobeX = if GlobeX and !GlobeX[1]
            then initHigh
            else if GlobeX and initHigh > iterHighestPrice_GlobeX[1]
                then initHigh
            else iterHighestPrice_GlobeX[1];
        ## Iteratively discover the Highest Price occurring during the desired time period
def iterHighestBar_GlobeX = if GlobeX and initHigh == iterHighestPrice_GlobeX
            then bn
            else Double.NaN;
        ## Iteratively discover the bar at which the Highest Price occurs
def HighestHigh_GlobeX = if BarNumber() == HighestAll(iterHighestBar_GlobeX)
            then iterHighestPrice_GlobeX
            else HighestHigh_GlobeX[1];

        ## define a variable which is assigned a value equal to the Highest High
        ## beginning with the bar at which the highest high occurs and then
        ## assign that value (highest high) to any future bars

## Switch Code
plot HighestHigh_GlobeX_plot;
HighestHigh_GlobeX_plot.SetDefaultColor(Color.CYAN);
switch (HighestHighGlobeX)
{
    case "Do Not Display":
        HighestHigh_GlobeX_plot = nan;
    case "From High to Current Bar":
        HighestHigh_GlobeX_plot =
                if Between(bn, HighestAll(iterHighestBar_GlobeX), currentBar)
                then HighestHigh_GlobeX
                else nan;
    case "From High into Expansion Area":
        HighestHigh_GlobeX_plot =
                if bn >= HighestAll(iterHighestBar_GlobeX)
                then HighestHigh_GlobeX
                else nan;
    case "Entire Chart Time Frame":
        HighestHigh_GlobeX_plot =
                HighestAll(HighestHigh_Globex);
}
## End Switch Code

## addChartBubble Code
input showGlobeX_HHighBubble = yes;
AddChartBubble(x_AxisLastExpansionBar and showGlobeX_HHighBubble, HighestHigh_GlobeX_plot, "HighestHigh_GlobeX", HighestHigh_GlobeX_plot.TakeValueColor());
## End GlobeX Highest High Code
## -----  -----  -----  -----  -----  -----  -----  -----

## Begin GlobeX Lowest Low Code
## Inputs
input LowestLowGlobeX = {"Do Not Display", "From Low to Current Bar",  default "From Low into Expansion Area", "Entire Chart Time Frame"};

 
## Definitions
def iterLowestPrice_GlobeX = if GlobeX and !GlobeX[1] or bn == 1
            then initLow
            else if GlobeX and initLow < iterLowestPrice_GlobeX[1]
                then initLow
            else iterLowestPrice_GlobeX[1];

def iterLowestBar_GlobeX = if GlobeX and vLow == iterLowestPrice_GlobeX
            then bn
            else Double.NaN;

def LowestLow_GlobeX = if BarNumber() == HighestAll(iterLowestBar_GlobeX)
            then iterLowestPrice_GlobeX
            else LowestLow_GlobeX[1];

## Switch Code
plot LowestLow_GlobeX_plot;
LowestLow_GlobeX_plot.SetDefaultColor(Color.CYAN);
switch (LowestLowGlobeX)
{
    case "Do Not Display":
        LowestLow_GlobeX_plot = nan;
    case "From Low to Current Bar":
        LowestLow_GlobeX_plot =
                if Between(bn, HighestAll(iterLowestBar_GlobeX), currentBar)
                then LowestLow_GlobeX
                else nan;
    case "From Low into Expansion Area":
        LowestLow_GlobeX_plot =
                if bn >= HighestAll(iterLowestBar_GlobeX)
                then LowestLow_GlobeX
                else nan;
    case "Entire Chart Time Frame":
        LowestLow_GlobeX_plot =
                 HighestAll(LowestLow_GlobeX);
}
## End Switch Code

## addChartBubble Code
input showGlobeX_LLowBubble = yes;
AddChartBubble(x_AxisLastExpansionBar and showGlobeX_LLowBubble, LowestLow_GlobeX_plot, "LowestLow_GlobeX", LowestLow_GlobeX_plot.TakeValueColor());
## End GlobeX Lowest Low Code
## End GlobeX Code
##  ===  ===  ===  ===  ===  ===  ===  ===  ===  ===  ===  ===  ===  ===  ===  ===

## Begin RTH Code
## Begin RTH Highest High Code
## Inputs
input HighestHighRTH = {"Do Not Display",  "From High to Current Bar",  default  "From High into Expansion Area", "Entire Chart Time Frame"};

## Definitions (specific to this script)
## def RTH = GetTime() > RegularTradingStart(GetYYYYMMDD());
## def RTH_v2 = if time crosses above RegularTradingStart(GetYYYYMMDD()) then bn else RTH[1];
def iterHighestPrice_RTH = if RTH and !RTH[1]
            then initHigh
            else if RTH and initHigh > iterHighestPrice_RTH[1]
                then initHigh
            else iterHighestPrice_RTH[1];
        ## Iteratively discover the Highest Price occurring during the desired time period

def iterHighestBar_RTH = if RTH and initHigh == iterHighestPrice_RTH
            then bn
            else Double.NaN;
        ## Iteratively discover the bar at which the Highest Price occurrs

 def HighestHigh_RTH = if BarNumber() == HighestAll(iterHighestBar_RTH)
            then iterHighestPrice_RTH
            else HighestHigh_RTH[1];
        ## define a variable which is assigned a value equal to the Highest High
        ## beginning with the bar at which the highest high occurs and then
        ## assign that value (highest high) to any future bars

##  Switch Code
plot HighestHigh_RTH_plot;
HighestHigh_RTH_plot.SetDefaultColor(Color.CYAN);
switch (HighestHighRTH)
{
    case "Do Not Display":
        HighestHigh_RTH_plot = nan;
    case "From High to Current Bar":
        HighestHigh_RTH_plot =
                if Between(bn, HighestAll(iterHighestBar_RTH), currentBar)
                then HighestHigh_RTH
                else nan;
    case "From High into Expansion Area":
        HighestHigh_RTH_plot =
                if bn >= HighestAll(iterHighestBar_RTH)
                then HighestHigh_RTH
                else nan;
    case "Entire Chart Time Frame":
        HighestHigh_RTH_plot =
                HighestAll(HighestHigh_RTH);
}
## End Switch Code
## addChartBubble Code
input showRTH_HHighBubble = yes;

AddChartBubble(x_AxisLastExpansionBar and  showRTH_HHighBubble, HighestHigh_RTH_plot, "HighestHigh_RTH", HighestHigh_RTH_plot.TakeValueColor());
## End RTH Highest High Code
## Begin RTH Lowest Low Code
## Inputs
input LowestLowRTH = {"Do Not Display",  "From High to Current Bar", default  "From High into Expansion Area", "Entire Chart Time Frame"};

## Definitions
def iterLowestPrice_RTH = if RTH and !RTH[1]
            then initLow
            else if RTH and initLow < iterLowestPrice_RTH[1]
                then initLow
            else iterLowestPrice_RTH[1];

def iterLowestBar_RTH = if RTH and initLow == iterLowestPrice_RTH
            then bn
            else Double.NaN;

def LowestLow_RTH = if BarNumber() == HighestAll(iterLowestBar_RTH)
            then iterLowestPrice_RTH
            else LowestLow_RTH[1];

##  Switch Code
plot LowestLow_RTH_plot;
LowestLow_RTH_plot.SetDefaultColor(Color.CYAN);
switch (LowestLowRTH)
{
    case "Do Not Display":
            LowestLow_RTH_plot = nan;
    case "From High to Current Bar":
            LowestLow_RTH_plot =
                if Between(bn, HighestAll(iterLowestBar_RTH), currentBar)
                then LowestLow_RTH
                else nan;
    case "From High into Expansion Area":
            LowestLow_RTH_plot =
                if bn >= HighestAll(iterLowestBar_RTH)
                then LowestLow_RTH
                else nan;
    case "Entire Chart Time Frame":
            LowestLow_RTH_plot =
                HighestAll(LowestLow_RTH);
}
## End Switch Code

## addChartBubble Code
input showRTH_LLowBubble = yes;
AddChartBubble(x_AxisLastExpansionBar and showRTH_LLowBubble, LowestLow_RTH_plot, "LowestLow_RTH", LowestLow_RTH_plot.TakeValueColor());
## End RTH Lowest Low Code
## End RTH Code
##  ===  ===  ===  ===  ===  ===  ===  ===  ===  ===  ===  ===  ===  ===  ===  ===

## Begin CTF Code
## Begin CTF Highest High Code
## Begin Highest High Chart Time Frame
## Inputs
input HighestHighCTF = {"Do Not Display", "From High to Current Bar", default "From High into Expansion Area", "Entire Chart Time Frame"};

 
## Definitions (specific to this script)
def iterHighestPrice_CTF = HighestAll(vHigh);  # Highest High Price for the Chart Time Frame
def HighestHighBar_CTF = HighestAll(if vHigh == HighestAll(vHigh) then bn else nan);
##  Switch Code
plot HighestHigh_CTF_plot;
HighestHigh_CTF_plot.setDefaultColor(color.CYAN);
switch (HighestHighCTF)
{
    Case "Do Not Display":
        HighestHigh_CTF_plot = nan;
    Case "From High to Current Bar":
        HighestHigh_CTF_plot = if Between(bn, HighestHighBar_CTF, currentBar) then iterHighestPrice_CTF else nan;
    Case "From High into Expansion Area":
        HighestHigh_CTF_plot = if bn >= HighestHighBar_CTF then iterHighestPrice_CTF else nan;
    Case "Entire Chart Time Frame":
        HighestHigh_CTF_plot = iterHighestPrice_CTF;
}
## End Switch Code
## addChartBubble Code
input showCTF_HHighBubble = yes;
AddChartBubble(x_AxisLastExpansionBar and showCTF_HHighBubble, HighestHigh_CTF_plot, "HighestHigh_CTF", HighestHigh_CTF_plot.TakeValueColor());
## End CTF Highest High Code

## Begin CTF Lowest Low Code
## Inputs
input LowestLowCTF = {"Do Not Display", "From Low to Current Bar", default "From Low into Expansion Area", "Across Entire Chart"};
## Definitions (specific to this script)
def iterLowestPrice_CTF = LowestAll(vLow);
def iterLowestBar_CTF = HighestAll(if vLow == LowestAll(vLow) then bn else nan);

##  Switch Code
plot LowestLow_CTF_plot;
LowestLow_CTF_plot.setDefaultColor(color.CYAN);
switch (LowestLowCTF)
{
    Case "Do Not Display":
        LowestLow_CTF_plot = nan;
    Case "From Low to Current Bar":
        LowestLow_CTF_plot = if Between(bn, iterLowestBar_CTF, currentBar) then iterLowestPrice_CTF else nan;
    Case "From Low into Expansion Area":
        LowestLow_CTF_plot = if bn >= iterLowestBar_CTF then iterLowestPrice_CTF else nan;
    Case "Across Entire Chart":
        LowestLow_CTF_plot = iterLowestPrice_CTF;
}
## End Switch Code

## addChartBubble Code
input showCTF_LLowBubble = yes;
AddChartBubble(x_AxisLastExpansionBar and showCTF_LLowBubble, LowestLow_CTF_plot, "LowestLow_CTF", LowestLow_CTF_plot.TakeValueColor());
## End CTF Lowest Low Code
## End CTF Code
## End WIP_PickAPlotPlus_v0
I've been looking for a key-levels indicator and this one seems great. What do the different levels mean? What does Globex mean? TIA!
 
Last edited by a moderator:
I've been looking for a key-levels indicator and this one seems great. What do the different levels mean? What does Globex mean? TIA!
HG6L0Pe.png

Ruby:
## OneNote Archive Name: WIP_PickAPlotPlus_v03
## Suggested Tos Name using JQ naming convention: WIP_PickAPlotPlus_v03
## OneNote Section: Support Resistance
## Archive Date:
## Provenance: scripted and archived by JQ

## Archive, Usage or Lounge Notes:
    # Concept by JQ
    # Initialization and vastly superior logic by Nube...thank you!

 ## Drafting Notes:
    # 02.26.2019  Begin drafting 
## End OneNote Archive Header

 declare upper;

# Universal Definitions using Padawan variable naming convention (JQ) v03.04.2019
# iData Definitions
    def vHigh = high;  # creates the variable vHigh.  Use of the variable reduce data calls to tos iData server
    def initHigh =  CompoundValue(1, high, high);  # creates and initialized variable for High
    def vLow = low;
    def initLow = CompoundValue(1, low, low);
    def vOpen = open;
    def initOpen = CompoundValue(1, open, open);
    def vClose = close;
    def initClose = CompoundValue(1, close, close);
    def vVolume = volume;
    def initVolume = CompoundValue(1, volume, volume);
    def nan = Double.NaN;

# Bar Definitions (Time & Date) 
    def bn = BarNumber();
    def currentBar = HighestAll(if !IsNaN(vHigh) then bn else nan);
    def Today = GetDay() ==GetLastDay();
    def time = GetTime();
    def GlobeX = GetTime() < RegularTradingStart(GetYYYYMMDD());
    # def globeX_v2 = if time crosses below RegularTradingEnd(GetYYYYMMDD()) then bn else GlobeX[1];
    def RTS  = RegularTradingStart(GetYYYYMMDD());
    def RTE  = RegularTradingEnd(GetYYYYMMDD());
    def RTH = GetTime() > RegularTradingStart(GetYYYYMMDD());
    def RTH_v2 = if time crosses above RegularTradingStart(GetYYYYMMDD()) then bn else RTH[1];

# Bubble Locations
    def x_AxisLastExpansionBar = BarNumber() == HighestAll(BarNumber());  #corrected 11.12.2018 (JQ) 
        # syntax: addChartBubble(x_AxisLastExpansionBar, y-axis coordinate," text", Color.LIME); #verified 12.25.2018 (JQ)

## Begin Globex Code
## Globex Highest High Code
## Inputs

input HighestHighGlobeX = {"Do Not Display",  "From High to Current Bar", default  "From High into Expansion Area", "Entire Chart Time Frame"};

#input "Highest High Test" = "the manual states this should function properly";
#addlabel(1,"Highest High Test",color.white);
## Definitions (specific to Globex script)

def iterHighestPrice_GlobeX = if GlobeX and !GlobeX[1]
            then initHigh
            else if GlobeX and initHigh > iterHighestPrice_GlobeX[1]
                then initHigh
            else iterHighestPrice_GlobeX[1];
        ## Iteratively discover the Highest Price occurring during the desired time period
def iterHighestBar_GlobeX = if GlobeX and initHigh == iterHighestPrice_GlobeX
            then bn
            else Double.NaN;
        ## Iteratively discover the bar at which the Highest Price occurs
def HighestHigh_GlobeX = if BarNumber() == HighestAll(iterHighestBar_GlobeX)
            then iterHighestPrice_GlobeX
            else HighestHigh_GlobeX[1];

        ## define a variable which is assigned a value equal to the Highest High
        ## beginning with the bar at which the highest high occurs and then   
        ## assign that value (highest high) to any future bars

## Switch Code
plot HighestHigh_GlobeX_plot;
HighestHigh_GlobeX_plot.SetDefaultColor(Color.CYAN);
switch (HighestHighGlobeX)
{
    case "Do Not Display":
        HighestHigh_GlobeX_plot = nan;
    case "From High to Current Bar":
        HighestHigh_GlobeX_plot =
                if Between(bn, HighestAll(iterHighestBar_GlobeX), currentBar)
                then HighestHigh_GlobeX
                else nan;
    case "From High into Expansion Area":
        HighestHigh_GlobeX_plot =
                if bn >= HighestAll(iterHighestBar_GlobeX)
                then HighestHigh_GlobeX
                else nan;
    case "Entire Chart Time Frame":
        HighestHigh_GlobeX_plot =
                HighestAll(HighestHigh_Globex);
}
## End Switch Code

## addChartBubble Code
input showGlobeX_HHighBubble = yes;
AddChartBubble(x_AxisLastExpansionBar and showGlobeX_HHighBubble, HighestHigh_GlobeX_plot, "HighestHigh_GlobeX", HighestHigh_GlobeX_plot.TakeValueColor());
## End GlobeX Highest High Code
## -----  -----  -----  -----  -----  -----  -----  -----

## Begin GlobeX Lowest Low Code
## Inputs
input LowestLowGlobeX = {"Do Not Display", "From Low to Current Bar",  default "From Low into Expansion Area", "Entire Chart Time Frame"};

 
## Definitions
def iterLowestPrice_GlobeX = if GlobeX and !GlobeX[1] or bn == 1
            then initLow
            else if GlobeX and initLow < iterLowestPrice_GlobeX[1]
                then initLow
            else iterLowestPrice_GlobeX[1];

def iterLowestBar_GlobeX = if GlobeX and vLow == iterLowestPrice_GlobeX
            then bn
            else Double.NaN;

def LowestLow_GlobeX = if BarNumber() == HighestAll(iterLowestBar_GlobeX)
            then iterLowestPrice_GlobeX
            else LowestLow_GlobeX[1];

## Switch Code
plot LowestLow_GlobeX_plot;
LowestLow_GlobeX_plot.SetDefaultColor(Color.CYAN);
switch (LowestLowGlobeX)
{
    case "Do Not Display":
        LowestLow_GlobeX_plot = nan;
    case "From Low to Current Bar":
        LowestLow_GlobeX_plot =
                if Between(bn, HighestAll(iterLowestBar_GlobeX), currentBar)
                then LowestLow_GlobeX
                else nan;
    case "From Low into Expansion Area":
        LowestLow_GlobeX_plot =
                if bn >= HighestAll(iterLowestBar_GlobeX)
                then LowestLow_GlobeX
                else nan;
    case "Entire Chart Time Frame":
        LowestLow_GlobeX_plot =
                 HighestAll(LowestLow_GlobeX);
}
## End Switch Code

## addChartBubble Code
input showGlobeX_LLowBubble = yes;
AddChartBubble(x_AxisLastExpansionBar and showGlobeX_LLowBubble, LowestLow_GlobeX_plot, "LowestLow_GlobeX", LowestLow_GlobeX_plot.TakeValueColor());
## End GlobeX Lowest Low Code
## End GlobeX Code
##  ===  ===  ===  ===  ===  ===  ===  ===  ===  ===  ===  ===  ===  ===  ===  ===

## Begin RTH Code
## Begin RTH Highest High Code
## Inputs
input HighestHighRTH = {"Do Not Display",  "From High to Current Bar",  default  "From High into Expansion Area", "Entire Chart Time Frame"};

## Definitions (specific to this script)
## def RTH = GetTime() > RegularTradingStart(GetYYYYMMDD());
## def RTH_v2 = if time crosses above RegularTradingStart(GetYYYYMMDD()) then bn else RTH[1];
def iterHighestPrice_RTH = if RTH and !RTH[1]
            then initHigh
            else if RTH and initHigh > iterHighestPrice_RTH[1]
                then initHigh
            else iterHighestPrice_RTH[1];
        ## Iteratively discover the Highest Price occurring during the desired time period

def iterHighestBar_RTH = if RTH and initHigh == iterHighestPrice_RTH
            then bn
            else Double.NaN;
        ## Iteratively discover the bar at which the Highest Price occurrs

 def HighestHigh_RTH = if BarNumber() == HighestAll(iterHighestBar_RTH)
            then iterHighestPrice_RTH
            else HighestHigh_RTH[1];
        ## define a variable which is assigned a value equal to the Highest High
        ## beginning with the bar at which the highest high occurs and then   
        ## assign that value (highest high) to any future bars

##  Switch Code
plot HighestHigh_RTH_plot;
HighestHigh_RTH_plot.SetDefaultColor(Color.CYAN);
switch (HighestHighRTH)
{
    case "Do Not Display":
        HighestHigh_RTH_plot = nan;
    case "From High to Current Bar":
        HighestHigh_RTH_plot =
                if Between(bn, HighestAll(iterHighestBar_RTH), currentBar)
                then HighestHigh_RTH
                else nan;
    case "From High into Expansion Area":
        HighestHigh_RTH_plot =
                if bn >= HighestAll(iterHighestBar_RTH)
                then HighestHigh_RTH
                else nan;
    case "Entire Chart Time Frame":
        HighestHigh_RTH_plot =
                HighestAll(HighestHigh_RTH);
}
## End Switch Code
## addChartBubble Code
input showRTH_HHighBubble = yes;

AddChartBubble(x_AxisLastExpansionBar and  showRTH_HHighBubble, HighestHigh_RTH_plot, "HighestHigh_RTH", HighestHigh_RTH_plot.TakeValueColor());
## End RTH Highest High Code
## Begin RTH Lowest Low Code
## Inputs
input LowestLowRTH = {"Do Not Display",  "From High to Current Bar", default  "From High into Expansion Area", "Entire Chart Time Frame"};

## Definitions
def iterLowestPrice_RTH = if RTH and !RTH[1]
            then initLow
            else if RTH and initLow < iterLowestPrice_RTH[1]
                then initLow
            else iterLowestPrice_RTH[1];

def iterLowestBar_RTH = if RTH and initLow == iterLowestPrice_RTH
            then bn
            else Double.NaN;

def LowestLow_RTH = if BarNumber() == HighestAll(iterLowestBar_RTH)
            then iterLowestPrice_RTH
            else LowestLow_RTH[1];

##  Switch Code
plot LowestLow_RTH_plot;
LowestLow_RTH_plot.SetDefaultColor(Color.CYAN);
switch (LowestLowRTH)
{
    case "Do Not Display":
            LowestLow_RTH_plot = nan;
    case "From High to Current Bar":
            LowestLow_RTH_plot =
                if Between(bn, HighestAll(iterLowestBar_RTH), currentBar)
                then LowestLow_RTH
                else nan;
    case "From High into Expansion Area":
            LowestLow_RTH_plot =
                if bn >= HighestAll(iterLowestBar_RTH)
                then LowestLow_RTH
                else nan;
    case "Entire Chart Time Frame":
            LowestLow_RTH_plot =
                HighestAll(LowestLow_RTH);
}
## End Switch Code

## addChartBubble Code
input showRTH_LLowBubble = yes;
AddChartBubble(x_AxisLastExpansionBar and showRTH_LLowBubble, LowestLow_RTH_plot, "LowestLow_RTH", LowestLow_RTH_plot.TakeValueColor());
## End RTH Lowest Low Code
## End RTH Code
##  ===  ===  ===  ===  ===  ===  ===  ===  ===  ===  ===  ===  ===  ===  ===  ===

## Begin CTF Code
## Begin CTF Highest High Code
## Begin Highest High Chart Time Frame
## Inputs
input HighestHighCTF = {"Do Not Display", "From High to Current Bar", default "From High into Expansion Area", "Entire Chart Time Frame"};

 
## Definitions (specific to this script)
def iterHighestPrice_CTF = HighestAll(vHigh);  # Highest High Price for the Chart Time Frame
def HighestHighBar_CTF = HighestAll(if vHigh == HighestAll(vHigh) then bn else nan);
##  Switch Code
plot HighestHigh_CTF_plot;
HighestHigh_CTF_plot.setDefaultColor(color.CYAN);
switch (HighestHighCTF)
{
    Case "Do Not Display":
        HighestHigh_CTF_plot = nan;
    Case "From High to Current Bar":
        HighestHigh_CTF_plot = if Between(bn, HighestHighBar_CTF, currentBar) then iterHighestPrice_CTF else nan;
    Case "From High into Expansion Area":
        HighestHigh_CTF_plot = if bn >= HighestHighBar_CTF then iterHighestPrice_CTF else nan;
    Case "Entire Chart Time Frame":
        HighestHigh_CTF_plot = iterHighestPrice_CTF;
}
## End Switch Code
## addChartBubble Code
input showCTF_HHighBubble = yes;
AddChartBubble(x_AxisLastExpansionBar and showCTF_HHighBubble, HighestHigh_CTF_plot, "HighestHigh_CTF", HighestHigh_CTF_plot.TakeValueColor());
## End CTF Highest High Code

## Begin CTF Lowest Low Code
## Inputs
input LowestLowCTF = {"Do Not Display", "From Low to Current Bar", default "From Low into Expansion Area", "Across Entire Chart"};
## Definitions (specific to this script)
def iterLowestPrice_CTF = LowestAll(vLow);
def iterLowestBar_CTF = HighestAll(if vLow == LowestAll(vLow) then bn else nan);

##  Switch Code
plot LowestLow_CTF_plot;
LowestLow_CTF_plot.setDefaultColor(color.CYAN);
switch (LowestLowCTF)
{
    Case "Do Not Display":
        LowestLow_CTF_plot = nan;
    Case "From Low to Current Bar":
        LowestLow_CTF_plot = if Between(bn, iterLowestBar_CTF, currentBar) then iterLowestPrice_CTF else nan;
    Case "From Low into Expansion Area":
        LowestLow_CTF_plot = if bn >= iterLowestBar_CTF then iterLowestPrice_CTF else nan;
    Case "Across Entire Chart":
        LowestLow_CTF_plot = iterLowestPrice_CTF;
}
## End Switch Code

## addChartBubble Code
input showCTF_LLowBubble = yes;
AddChartBubble(x_AxisLastExpansionBar and showCTF_LLowBubble, LowestLow_CTF_plot, "LowestLow_CTF", LowestLow_CTF_plot.TakeValueColor());
## End CTF Lowest Low Code
## End CTF Code
## End WIP_PickAPlotPlus_v0

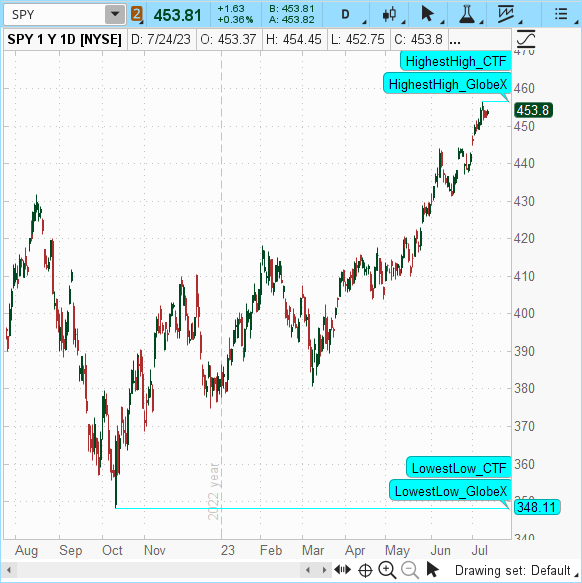
This script provides the highest and lowest price levels that are provided on your CTF (current time frame)
and the highest lowest for the GLobex session.

Globex refers to the Global Execution System (Globex), which is a global electronic trading platform used for futures and options contracts.
 

Join useThinkScript to post your question to a community of 21,000+ developers and traders.

Similar threads

Not the exact question you're looking for?

Start a new thread and receive assistance from our community.

87k+ Posts
330 Online
Create Post

Similar threads

Similar threads

The Market Trading Game Changer

Join 2,500+ subscribers inside the useThinkScript VIP Membership Club
  • Exclusive indicators
  • Proven strategies & setups
  • Private Discord community
  • ‘Buy The Dip’ signal alerts
  • Exclusive members-only content
  • Add-ons and resources
  • 1 full year of unlimited support

Frequently Asked Questions

What is useThinkScript?

useThinkScript is the #1 community of stock market investors using indicators and other tools to power their trading strategies. Traders of all skill levels use our forums to learn about scripting and indicators, help each other, and discover new ways to gain an edge in the markets.

How do I get started?

We get it. Our forum can be intimidating, if not overwhelming. With thousands of topics, tens of thousands of posts, our community has created an incredibly deep knowledge base for stock traders. No one can ever exhaust every resource provided on our site.

If you are new, or just looking for guidance, here are some helpful links to get you started.

What are the benefits of VIP Membership?
VIP members get exclusive access to these proven and tested premium indicators: Buy the Dip, Advanced Market Moves 2.0, Take Profit, and Volatility Trading Range. In addition, VIP members get access to over 50 VIP-only custom indicators, add-ons, and strategies, private VIP-only forums, private Discord channel to discuss trades and strategies in real-time, customer support, trade alerts, and much more. Learn all about VIP membership here.
How can I access the premium indicators?
To access the premium indicators, which are plug and play ready, sign up for VIP membership here.
Back
Top