Combine VWAP - Coppock

andriod_1011

New member
Hi All,
Here is my current chart setup
Aggregation : 5 min
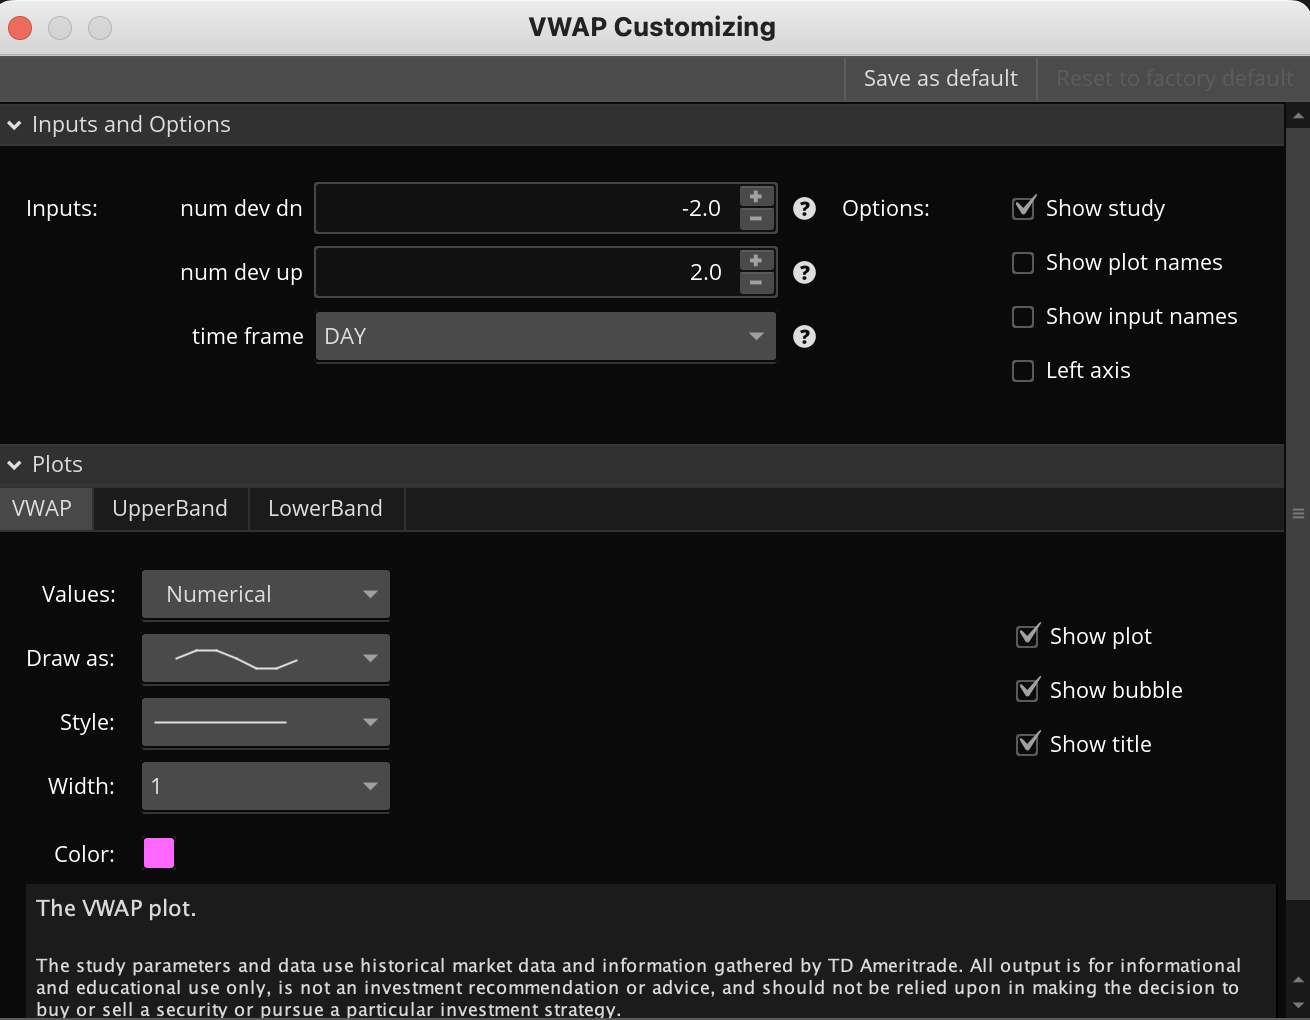
Plots : VWAP
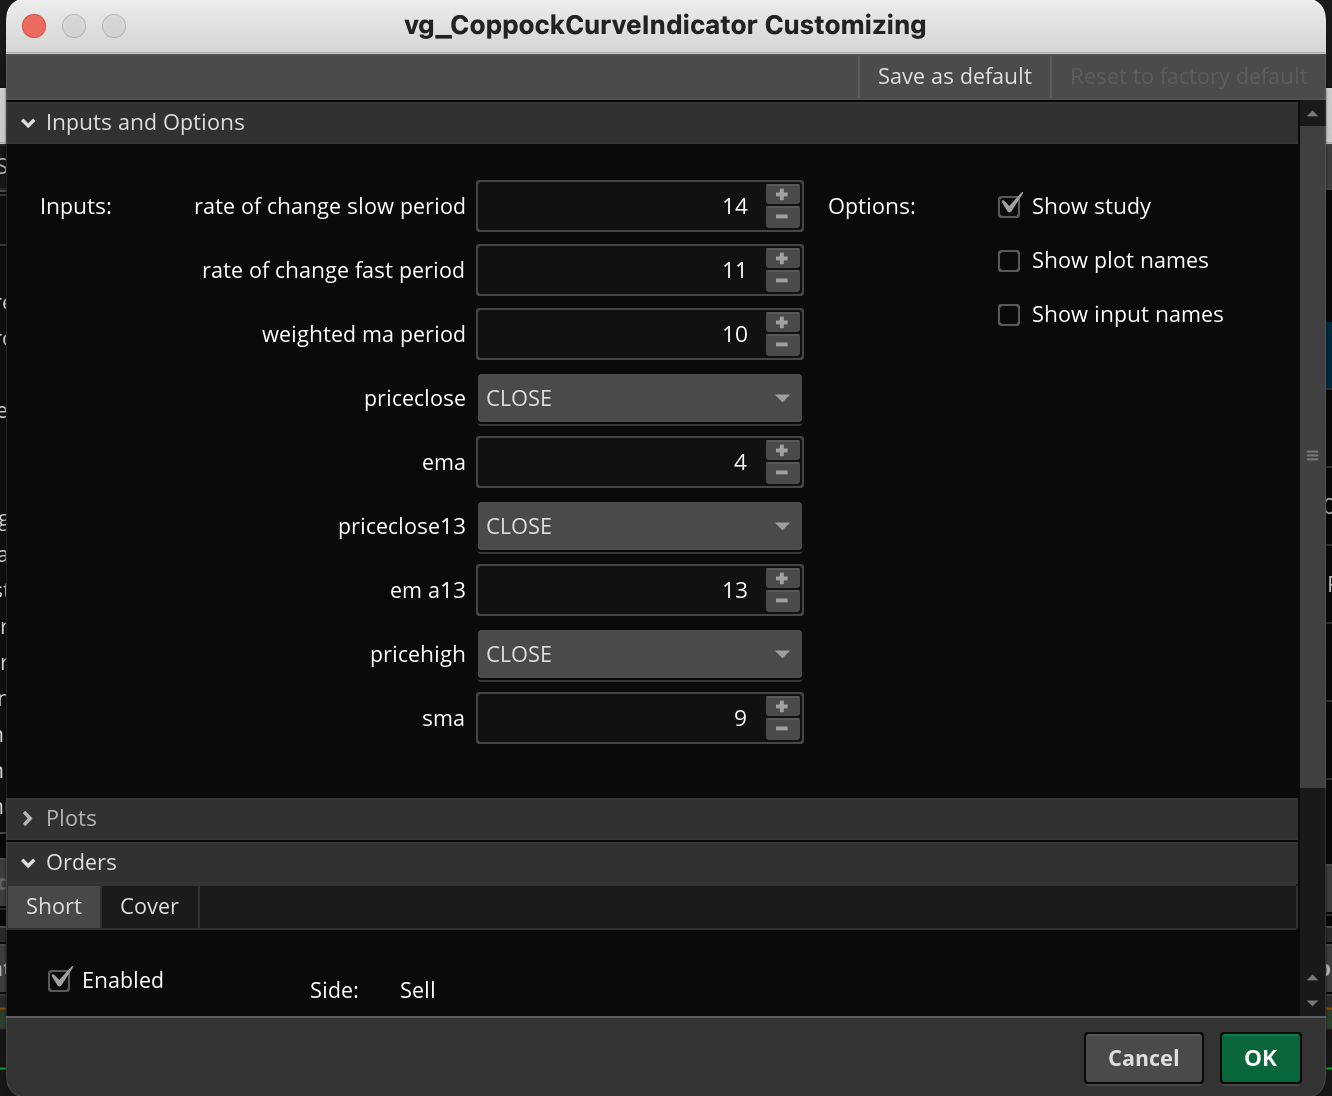
CoppockCurve (using custom script to plot the line on the chart)

Looking for : When the current candle opens below CoppockCurve and Closes above the VWAP should indicate it in the watch list column in a color. In the first image highlighted the condition in RED BOX with arrow.

Uploading the screenshot and scripts used for VWAP and CoppockCurve and the chart. Any help in building the script would be really helpful.

Thank you very much in advance for your time and efforts put in to develop the script.

mC2uODU.png


1ugJdUh.png

KFPVrht.png


Code:
### VWAP code

#
# TD Ameritrade IP Company, Inc. (c) 2011-2023
#

input numDevDn = -2.0;
input numDevUp = 2.0;
input timeFrame = {default DAY, WEEK, MONTH};

def cap = getAggregationPeriod();
def errorInAggregation =
    timeFrame == timeFrame.DAY and cap >= AggregationPeriod.WEEK or
    timeFrame == timeFrame.WEEK and cap >= AggregationPeriod.MONTH;
assert(!errorInAggregation, "timeFrame should be not less than current chart aggregation period");

def yyyyMmDd = getYyyyMmDd();
def periodIndx;
switch (timeFrame) {
case DAY:
    periodIndx = yyyyMmDd;
case WEEK:
    periodIndx = Floor((daysFromDate(first(yyyyMmDd)) + getDayOfWeek(first(yyyyMmDd))) / 7);
case MONTH:
    periodIndx = roundDown(yyyyMmDd / 100, 0);
}
def isPeriodRolled = compoundValue(1, periodIndx != periodIndx[1], yes);

def volumeSum;
def volumeVwapSum;
def volumeVwap2Sum;

if (isPeriodRolled) {
    volumeSum = volume;
    volumeVwapSum = volume * vwap;
    volumeVwap2Sum = volume * Sqr(vwap);
} else {
    volumeSum = compoundValue(1, volumeSum[1] + volume, volume);
    volumeVwapSum = compoundValue(1, volumeVwapSum[1] + volume * vwap, volume * vwap);
    volumeVwap2Sum = compoundValue(1, volumeVwap2Sum[1] + volume * Sqr(vwap), volume * Sqr(vwap));
}
def price = volumeVwapSum / volumeSum;
def deviation = Sqrt(Max(volumeVwap2Sum / volumeSum - Sqr(price), 0));

plot VWAP = price;
plot UpperBand = price + numDevUp * deviation;
plot LowerBand = price + numDevDn * deviation;

VWAP.setDefaultColor(getColor(0));
UpperBand.setDefaultColor(getColor(2));
LowerBand.setDefaultColor(getColor(4));


Code:
### CoppockCock Curve Indicator script


input RateOfChangeSlowPeriod = 14;
input RateOfChangeFastPeriod = 11;
input WeightedMAPeriod = 10;

def AggregationPeriod = if (getAggregationPeriod() < AggregationPeriod.HOUR) then AggregationPeriod.HOUR else getAggregationPeriod();

def price = close(period = AggregationPeriod);

def ROC1 = if price[RateOfChangeSlowPeriod]!=0 then (price/price[RateOfChangeSlowPeriod]-1)*100 else 0;
def ROC2 = if price[RateOfChangeFastPeriod]!=0 then (price/price[RateOfChangeFastPeriod]-1)*100 else 0;

def Coppock = WMA(ROC1 + ROC2, WeightedMAPeriod);

def ZeroLine = 0;

def BuyNow = Coppock[1] < 0 and Coppock > Coppock[1] and Coppock[1] < Coppock[2];
#plot Buy1 = BuyNow;
#Buy1.SetPaintingStrategy(PaintingStrategy.BOOLEAN_ARROW_UP);
#Buy1.SetLineWeight(1);
#Buy1.AssignValueColor(Color.WHITE);

def SellNow = Coppock[1] > 0 and Coppock < Coppock[1] and Coppock[1] > Coppock[2];
plot Sell1 = SellNow;
Sell1.SetPaintingStrategy(PaintingStrategy.BOOLEAN_ARROW_DoWN);
Sell1.SetLineWeight(1);
Sell1.AssignValueColor(Color.WHITE);

input priceclose = close;
input EMA = 4;
def displaceclose = 0;

input priceclose13 = close;
input EMA13 = 13;
def displaceclose13 = 0;

input pricehigh = close;
input SMA = 9;
def displacehigh = 0;

def AvgExpema = ExpAverage(priceclose[-displaceclose], EMA);
def AvgExpsma = Average(pricehigh[-displacehigh], SMA);
def AvgExp13 = ExpAverage(priceclose13[-displaceclose13], EMA13);

plot ln1 = AvgExp13;
ln1.SetDefaultColor(CreateColor(145, 210, 144));
ln1.SetLineWeight(2);

def US =  AvgExpema crosses above AvgExpsma;
def DS = AvgExpema crosses below AvgExpsma ;

AddOrder(OrderType.SELL_AUTO, condition = Sell1, price = close,1, tickcolor = Color.LIME, arrowcolor = Color.LIME, name = "Short");

AddOrder(OrderType.BUY_AUTO, condition = US, price = close,1, tickcolor = Color.LIME, arrowcolor = Color.LIME, name = "Cover");

AddLabel(yes,"4/9 Crossover Hidden. 13ema on",color.Yellow);

Thanks,
-Andriod.
 
Hi All,
Here is my current chart setup
Aggregation : 5 min
Plots : VWAP
CoppockCurve (using custom script to plot the line on the chart)

Looking for : When the current candle opens below CoppockCurve and Closes above the VWAP should indicate it in the watch list column in a color. In the first image highlighted the condition in RED BOX with arrow.

Uploading the screenshot and scripts used for VWAP and CoppockCurve and the chart. Any help in building the script would be really helpful.

Thank you very much in advance for your time and efforts put in to develop the script.
mC2uODU.png


1ugJdUh.png

KFPVrht.png


Code:
### VWAP code

#
# TD Ameritrade IP Company, Inc. (c) 2011-2023
#

input numDevDn = -2.0;
input numDevUp = 2.0;
input timeFrame = {default DAY, WEEK, MONTH};

def cap = getAggregationPeriod();
def errorInAggregation =
    timeFrame == timeFrame.DAY and cap >= AggregationPeriod.WEEK or
    timeFrame == timeFrame.WEEK and cap >= AggregationPeriod.MONTH;
assert(!errorInAggregation, "timeFrame should be not less than current chart aggregation period");

def yyyyMmDd = getYyyyMmDd();
def periodIndx;
switch (timeFrame) {
case DAY:
    periodIndx = yyyyMmDd;
case WEEK:
    periodIndx = Floor((daysFromDate(first(yyyyMmDd)) + getDayOfWeek(first(yyyyMmDd))) / 7);
case MONTH:
    periodIndx = roundDown(yyyyMmDd / 100, 0);
}
def isPeriodRolled = compoundValue(1, periodIndx != periodIndx[1], yes);

def volumeSum;
def volumeVwapSum;
def volumeVwap2Sum;

if (isPeriodRolled) {
    volumeSum = volume;
    volumeVwapSum = volume * vwap;
    volumeVwap2Sum = volume * Sqr(vwap);
} else {
    volumeSum = compoundValue(1, volumeSum[1] + volume, volume);
    volumeVwapSum = compoundValue(1, volumeVwapSum[1] + volume * vwap, volume * vwap);
    volumeVwap2Sum = compoundValue(1, volumeVwap2Sum[1] + volume * Sqr(vwap), volume * Sqr(vwap));
}
def price = volumeVwapSum / volumeSum;
def deviation = Sqrt(Max(volumeVwap2Sum / volumeSum - Sqr(price), 0));

plot VWAP = price;
plot UpperBand = price + numDevUp * deviation;
plot LowerBand = price + numDevDn * deviation;

VWAP.setDefaultColor(getColor(0));
UpperBand.setDefaultColor(getColor(2));
LowerBand.setDefaultColor(getColor(4));


Code:
### CoppockCock Curve Indicator script


input RateOfChangeSlowPeriod = 14;
input RateOfChangeFastPeriod = 11;
input WeightedMAPeriod = 10;

def AggregationPeriod = if (getAggregationPeriod() < AggregationPeriod.HOUR) then AggregationPeriod.HOUR else getAggregationPeriod();

def price = close(period = AggregationPeriod);

def ROC1 = if price[RateOfChangeSlowPeriod]!=0 then (price/price[RateOfChangeSlowPeriod]-1)*100 else 0;
def ROC2 = if price[RateOfChangeFastPeriod]!=0 then (price/price[RateOfChangeFastPeriod]-1)*100 else 0;

def Coppock = WMA(ROC1 + ROC2, WeightedMAPeriod);

def ZeroLine = 0;

def BuyNow = Coppock[1] < 0 and Coppock > Coppock[1] and Coppock[1] < Coppock[2];
#plot Buy1 = BuyNow;
#Buy1.SetPaintingStrategy(PaintingStrategy.BOOLEAN_ARROW_UP);
#Buy1.SetLineWeight(1);
#Buy1.AssignValueColor(Color.WHITE);

def SellNow = Coppock[1] > 0 and Coppock < Coppock[1] and Coppock[1] > Coppock[2];
plot Sell1 = SellNow;
Sell1.SetPaintingStrategy(PaintingStrategy.BOOLEAN_ARROW_DoWN);
Sell1.SetLineWeight(1);
Sell1.AssignValueColor(Color.WHITE);

input priceclose = close;
input EMA = 4;
def displaceclose = 0;

input priceclose13 = close;
input EMA13 = 13;
def displaceclose13 = 0;

input pricehigh = close;
input SMA = 9;
def displacehigh = 0;

def AvgExpema = ExpAverage(priceclose[-displaceclose], EMA);
def AvgExpsma = Average(pricehigh[-displacehigh], SMA);
def AvgExp13 = ExpAverage(priceclose13[-displaceclose13], EMA13);

plot ln1 = AvgExp13;
ln1.SetDefaultColor(CreateColor(145, 210, 144));
ln1.SetLineWeight(2);

def US =  AvgExpema crosses above AvgExpsma;
def DS = AvgExpema crosses below AvgExpsma ;

AddOrder(OrderType.SELL_AUTO, condition = Sell1, price = close,1, tickcolor = Color.LIME, arrowcolor = Color.LIME, name = "Short");

AddOrder(OrderType.BUY_AUTO, condition = US, price = close,1, tickcolor = Color.LIME, arrowcolor = Color.LIME, name = "Cover");

AddLabel(yes,"4/9 Crossover Hidden. 13ema on",color.Yellow);

Thanks,
-Andriod.

please clarify WHERE you want to see something. chart or watchlist?
you mention both but don't specify.

if a column, then WHAT do you want to see? a price? word? a dash and a color?
..'indicate it in the watch list column in a color'..
 
Hello Sir,
I've be monitoring these two indicators on my TOS since for more than 3 months, and observed that whenver such situation comes where the cusrrent candel opens below Coppock and closes above VWAP then there is upward moment hence i'm looking for a script which can give me some indication on watchlist that the candle is opening below and closing above. Any help in this regards will really help me put my strategey .
 
Last edited by a moderator:
Hi All,
Here is my current chart setup
Aggregation : 5 min
Plots : VWAP
CoppockCurve (using custom script to plot the line on the chart)

Looking for : When the current candle opens below CoppockCurve and Closes above the VWAP should indicate it in the watch list column in a color. In the first image highlighted the condition in RED BOX with arrow.

Uploading the screenshot and scripts used for VWAP and CoppockCurve and the chart. Any help in building the script would be really helpful.

Thank you very much in advance for your time and efforts put in to develop the script.
mC2uODU.png


1ugJdUh.png

KFPVrht.png


Code:
### VWAP code

#
# TD Ameritrade IP Company, Inc. (c) 2011-2023
#

input numDevDn = -2.0;
input numDevUp = 2.0;
input timeFrame = {default DAY, WEEK, MONTH};

def cap = getAggregationPeriod();
def errorInAggregation =
    timeFrame == timeFrame.DAY and cap >= AggregationPeriod.WEEK or
    timeFrame == timeFrame.WEEK and cap >= AggregationPeriod.MONTH;
assert(!errorInAggregation, "timeFrame should be not less than current chart aggregation period");

def yyyyMmDd = getYyyyMmDd();
def periodIndx;
switch (timeFrame) {
case DAY:
    periodIndx = yyyyMmDd;
case WEEK:
    periodIndx = Floor((daysFromDate(first(yyyyMmDd)) + getDayOfWeek(first(yyyyMmDd))) / 7);
case MONTH:
    periodIndx = roundDown(yyyyMmDd / 100, 0);
}
def isPeriodRolled = compoundValue(1, periodIndx != periodIndx[1], yes);

def volumeSum;
def volumeVwapSum;
def volumeVwap2Sum;

if (isPeriodRolled) {
    volumeSum = volume;
    volumeVwapSum = volume * vwap;
    volumeVwap2Sum = volume * Sqr(vwap);
} else {
    volumeSum = compoundValue(1, volumeSum[1] + volume, volume);
    volumeVwapSum = compoundValue(1, volumeVwapSum[1] + volume * vwap, volume * vwap);
    volumeVwap2Sum = compoundValue(1, volumeVwap2Sum[1] + volume * Sqr(vwap), volume * Sqr(vwap));
}
def price = volumeVwapSum / volumeSum;
def deviation = Sqrt(Max(volumeVwap2Sum / volumeSum - Sqr(price), 0));

plot VWAP = price;
plot UpperBand = price + numDevUp * deviation;
plot LowerBand = price + numDevDn * deviation;

VWAP.setDefaultColor(getColor(0));
UpperBand.setDefaultColor(getColor(2));
LowerBand.setDefaultColor(getColor(4));


Code:
### CoppockCock Curve Indicator script


input RateOfChangeSlowPeriod = 14;
input RateOfChangeFastPeriod = 11;
input WeightedMAPeriod = 10;

def AggregationPeriod = if (getAggregationPeriod() < AggregationPeriod.HOUR) then AggregationPeriod.HOUR else getAggregationPeriod();

def price = close(period = AggregationPeriod);

def ROC1 = if price[RateOfChangeSlowPeriod]!=0 then (price/price[RateOfChangeSlowPeriod]-1)*100 else 0;
def ROC2 = if price[RateOfChangeFastPeriod]!=0 then (price/price[RateOfChangeFastPeriod]-1)*100 else 0;

def Coppock = WMA(ROC1 + ROC2, WeightedMAPeriod);

def ZeroLine = 0;

def BuyNow = Coppock[1] < 0 and Coppock > Coppock[1] and Coppock[1] < Coppock[2];
#plot Buy1 = BuyNow;
#Buy1.SetPaintingStrategy(PaintingStrategy.BOOLEAN_ARROW_UP);
#Buy1.SetLineWeight(1);
#Buy1.AssignValueColor(Color.WHITE);

def SellNow = Coppock[1] > 0 and Coppock < Coppock[1] and Coppock[1] > Coppock[2];
plot Sell1 = SellNow;
Sell1.SetPaintingStrategy(PaintingStrategy.BOOLEAN_ARROW_DoWN);
Sell1.SetLineWeight(1);
Sell1.AssignValueColor(Color.WHITE);

input priceclose = close;
input EMA = 4;
def displaceclose = 0;

input priceclose13 = close;
input EMA13 = 13;
def displaceclose13 = 0;

input pricehigh = close;
input SMA = 9;
def displacehigh = 0;

def AvgExpema = ExpAverage(priceclose[-displaceclose], EMA);
def AvgExpsma = Average(pricehigh[-displacehigh], SMA);
def AvgExp13 = ExpAverage(priceclose13[-displaceclose13], EMA13);

plot ln1 = AvgExp13;
ln1.SetDefaultColor(CreateColor(145, 210, 144));
ln1.SetLineWeight(2);

def US =  AvgExpema crosses above AvgExpsma;
def DS = AvgExpema crosses below AvgExpsma ;

AddOrder(OrderType.SELL_AUTO, condition = Sell1, price = close,1, tickcolor = Color.LIME, arrowcolor = Color.LIME, name = "Short");

AddOrder(OrderType.BUY_AUTO, condition = US, price = close,1, tickcolor = Color.LIME, arrowcolor = Color.LIME, name = "Cover");

AddLabel(yes,"4/9 Crossover Hidden. 13ema on",color.Yellow);

Thanks,
-Andriod.
hi forums, a quick question for all the great coder here! will be possible to edit this strategy just to trade doing trading hours? example if is take a trade in the morning to close the trade by the End of the day. thank you in advance
 

Join useThinkScript to post your question to a community of 21,000+ developers and traders.

Similar threads

Not the exact question you're looking for?

Start a new thread and receive assistance from our community.

87k+ Posts
443 Online
Create Post

Similar threads

Similar threads

The Market Trading Game Changer

Join 2,500+ subscribers inside the useThinkScript VIP Membership Club
  • Exclusive indicators
  • Proven strategies & setups
  • Private Discord community
  • ‘Buy The Dip’ signal alerts
  • Exclusive members-only content
  • Add-ons and resources
  • 1 full year of unlimited support

Frequently Asked Questions

What is useThinkScript?

useThinkScript is the #1 community of stock market investors using indicators and other tools to power their trading strategies. Traders of all skill levels use our forums to learn about scripting and indicators, help each other, and discover new ways to gain an edge in the markets.

How do I get started?

We get it. Our forum can be intimidating, if not overwhelming. With thousands of topics, tens of thousands of posts, our community has created an incredibly deep knowledge base for stock traders. No one can ever exhaust every resource provided on our site.

If you are new, or just looking for guidance, here are some helpful links to get you started.

What are the benefits of VIP Membership?
VIP members get exclusive access to these proven and tested premium indicators: Buy the Dip, Advanced Market Moves 2.0, Take Profit, and Volatility Trading Range. In addition, VIP members get access to over 50 VIP-only custom indicators, add-ons, and strategies, private VIP-only forums, private Discord channel to discuss trades and strategies in real-time, customer support, trade alerts, and much more. Learn all about VIP membership here.
How can I access the premium indicators?
To access the premium indicators, which are plug and play ready, sign up for VIP membership here.
Back
Top