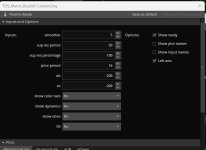
Combine Matrix & Lower Candle Study

jrj4774

New member
VIP

Attachments

  • MatrixSeries.jpg
    MatrixSeries.jpg
    85.2 KB · Views: 65
  • MatrixSeries_LowerStudies.jpg
    MatrixSeries_LowerStudies.jpg
    214.1 KB · Views: 65
  • MatrixSeries_LowerStudies_Combination.jpg
    MatrixSeries_LowerStudies_Combination.jpg
    156.3 KB · Views: 65
Last edited by a moderator:
Solution
I'm confused, why would you combine it with the lower candle study if you want it up on the main chart? Is your goal only to transfer the dots to the main chart?

Delete the second script, everything starting with the line "input Fill = yes;" and below.

Or just add this anywhere to the script:
hidepriceplot();

and get rid of Declare Lower;

edit:
If you only get rid of declare lower, it should prevent the left side y-axis. In this case, the "lower" candles will be on the same scale as the upper, and it won't look weird. This way you can use it as an upper and a lower study if you think you might be moving it around.
Code:
declare lower;
input Smoother = 5;
input SupResPeriod = 50;
input SupResPercentage = 100;
input PricePeriod = 16;
input ob = 200;
input os = -200;
input showColorBars = no; #COLOR BARS
input showDynamics = no; #Dynamic zones
input showOBOS = yes; #Show OB/OS
def nn = Smoother;
def ys1 = (high + low + close * 2) / 4;
def rk3 = ExpAverage(ys1, nn);
def rk4 = StDev(ys1, nn);
def rk5 = (ys1 - rk3) * 200 / rk4;
def rk6 = ExpAverage(rk5, nn);
def up = ExpAverage(rk6, nn);
def down = ExpAverage(up, nn);
def Oo = If(up < down, up, down);
def Hh = Oo;
def Ll = If(up < down, down, up);
def Cc = Ll;


def Lookback = SupResPeriod;
def PerCent = SupResPercentage;
def Pds = PricePeriod;

def C3 = CCI(length = Pds);

def Osc = C3;
def Value1 = Osc;
def Value2 = Highest(Value1, Lookback);
def Value3 = Lowest(Value1, Lookback);
def Value4 = Value2 - Value3;
def Value5 = Value4 * (PerCent / 100);
def ResistanceLine = Value3 + Value5;
def SupportLine = Value2 - Value5;


#PLOTS
plot pResistanceLine = ResistanceLine;
pResistanceLine.SetHiding(!showDynamics);

plot pSupportLine = SupportLine;
pSupportLine.SetHiding(!showDynamics);

def UpShape = if up > ob and up > down then
high
#highest(up,1) + 20
else if up > ob and up < down then
high#highest(down,1) + 20
else Double.NaN;

def DownShape = if down < os and up > down then
low
#lowest(down,1) - 20
else if down < os and up < down then
low#lowest(up,1) - 20
else Double.NaN;

def sState = if !isNan(UpShape) then 100 else if !isNan(DownShape) then -100 else sState[1];

plot pUP = UpShape;
pUP.SetPaintingStrategy(PaintingStrategy.TRIANGLES);
pUP.SetDefaultColor(Color.CYAN);
pUP.SetLineWeight(1);

plot pDown = DownShape;
pDown.SetPaintingStrategy(PaintingStrategy.TRIANGLES);
pDown.SetDefaultColor(Color.CYAN);
pDown.SetLineWeight(1);
;

input Fill = yes;
def O = open;
def H = high;
def L = low;
def C = close;
#== Up CANDLE
def UpO;
def UpH;
def UpL;
def UpC;
if O <= C
then {
    UpO = if Fill then C else O;
    UpH = H;
    UpL = L;
    UpC = if Fill then O else C;
} else {
    UpO = Double.NaN;
    UpH = Double.NaN;
    UpL = Double.NaN;
    UpC = Double.NaN;
}
#== Down CANDLE
def DnO;
def DnH;
def DnL;
def DnC;
if O >= C
then {
    DnO = if Fill then O else C;
    DnH = H;
    DnL = L;
    DnC = if Fill then C else O;
} else {
    DnO = Double.NaN;
    DnH = Double.NaN;
    DnL = Double.NaN;
    DnC = Double.NaN;
}
#== Doji CANDLE
def DUpO;
def DUpH;
def DUpL;
def DUpC;
if O == C
then {
    DUpO = O;
    DUpH = H;
    DUpL = L;
    DUpC = C;
} else {
    DUpO = Double.NaN;
    DUpH = Double.NaN;
    DUpL = Double.NaN;
    DUpC = Double.NaN;
}

def DDnO;
def DDnH;
def DDnL;
def DDnC;
if O == C
then {
    DDnO = O;
    DDnH = H;
    DDnL = L;
    DDnC = C;
} else {
    DDnO = Double.NaN;
    DDnH = Double.NaN;
    DDnL = Double.NaN;
    DDnC = Double.NaN;
}
#== Up & Down CANDLE colors
DefineGlobalColor("Up", GetColor(6));
AddChart(high = UpH, low = UpL, open = UpO, close = UpC, type = ChartType.CANDLE, GlobalColor("Up"));
DefineGlobalColor("Down", GetColor(5));
AddChart(high = DnH, low = DnL, open = DnO, close = DnC, type = ChartType.CANDLE, GlobalColor("Down"));

#== Doji CANDLE color
AddChart(high = DUpH, low = DUpL, open = DUpO, close = DUpO, type = ChartType.CANDLE, growColor = Color.WHITE);
AddChart(high = DDnH, low = DDnL, open = DDnO, close = DDnO, type = ChartType.CANDLE, growColor = Color.WHITE);

#== Last Price color
DefineGlobalColor("Last", GetColor(9));
AddChartBubble(IsNaN(C[-1]), text = Round(C, 2), "price location" = C, GlobalColor("Last"));

#== Highest & Lowest of period color
def HA = HighestAll(H);
def LA = LowestAll(L);
DefineGlobalColor("Highest", GetColor(6));
AddChartBubble(H == HA, H, "Hi: " + Round(HA, 2), GlobalColor("Highest"));
DefineGlobalColor("Lowest", GetColor(5));
AddChartBubble(L == LA, L, "Lo: " + Round(LA, 2), GlobalColor("Lowest"), no);
 

Join useThinkScript to post your question to a community of 21,000+ developers and traders.

@Joshua Thank you for your assistance. I just tried the script and the indictors are showing up, but then it seems like there's double candles... Is there a way to remove the overlay of candles. I have attached the screenshot. The left screen is the script you created. The right screenshot has the candles but the Matrix Script is below the script for comparison.

Thanks,
jrj4774
 

Attachments

  • Matrix_Candles.jpg
    Matrix_Candles.jpg
    355.5 KB · Views: 30
  • Matrix_Candles_Configurations.jpg
    Matrix_Candles_Configurations.jpg
    44.7 KB · Views: 29
I'm confused, why would you combine it with the lower candle study if you want it up on the main chart? Is your goal only to transfer the dots to the main chart?

Delete the second script, everything starting with the line "input Fill = yes;" and below.

Or just add this anywhere to the script:
hidepriceplot();

and get rid of Declare Lower;

edit:
If you only get rid of declare lower, it should prevent the left side y-axis. In this case, the "lower" candles will be on the same scale as the upper, and it won't look weird. This way you can use it as an upper and a lower study if you think you might be moving it around.
 
Last edited:
Solution
@Joshua - My goal is to add it on the main chart. but I was using it to comparison check to see the alignment. I just added "hidepriceplot();" to the script and there seems to be a minor bar discrepancies.

I also tried the other suggestion to removing Input fill =yes" but the square/dots are just floating and not near the bar candles.

The reason for the request is cause I have like 6 lower studies plus main chart, I'm trying to minimized the amount of lower studies so that it's not too overwhelming.

Thanks,
jrj4774
 

Attachments

  • Matrix_Candles_Configurations_2.jpg
    Matrix_Candles_Configurations_2.jpg
    183.8 KB · Views: 26
@Joshua

It works now ... and I just realized that the screenshot on the right had candles as HA. Can we add a script to turn the candles to show as HA instead of normal candles? I tried changing it in the appearance and it wouldnt work. I looked at the script and is it changing ChartType.CANDLE to ChartType.heikin Ashi?

Thanks,
jrj4774
 
As an upper, you can set the actual chart style to HA through the chart's settings, it doesn't appear that there's any need to change the code.

As a lower, I suppose we could use something like the lower candle study to make custom HA bars. I've never used those myself though, or any of the other goofy chart types.

I'd have to look into how they work.

By the way, post the code that you're using now on your own end. Possibly give me a share link to the chart you're using. I want to make sure that we don't keep talking about two different things.
 
Last edited:

Similar threads

Not the exact question you're looking for?

Start a new thread and receive assistance from our community.

87k+ Posts
540 Online
Create Post

Similar threads

Similar threads

The Market Trading Game Changer

Join 2,500+ subscribers inside the useThinkScript VIP Membership Club
  • Exclusive indicators
  • Proven strategies & setups
  • Private Discord community
  • ‘Buy The Dip’ signal alerts
  • Exclusive members-only content
  • Add-ons and resources
  • 1 full year of unlimited support

Frequently Asked Questions

What is useThinkScript?

useThinkScript is the #1 community of stock market investors using indicators and other tools to power their trading strategies. Traders of all skill levels use our forums to learn about scripting and indicators, help each other, and discover new ways to gain an edge in the markets.

How do I get started?

We get it. Our forum can be intimidating, if not overwhelming. With thousands of topics, tens of thousands of posts, our community has created an incredibly deep knowledge base for stock traders. No one can ever exhaust every resource provided on our site.

If you are new, or just looking for guidance, here are some helpful links to get you started.

What are the benefits of VIP Membership?
VIP members get exclusive access to these proven and tested premium indicators: Buy the Dip, Advanced Market Moves 2.0, Take Profit, and Volatility Trading Range. In addition, VIP members get access to over 50 VIP-only custom indicators, add-ons, and strategies, private VIP-only forums, private Discord channel to discuss trades and strategies in real-time, customer support, trade alerts, and much more. Learn all about VIP membership here.
How can I access the premium indicators?
To access the premium indicators, which are plug and play ready, sign up for VIP membership here.
Back
Top