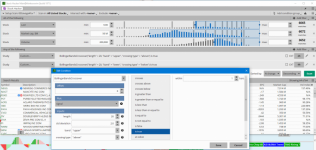
Hi Im new with this, I was looking at some code I found that plots me the entry when the price touches the lower band of Bollinger Bands of the previous day and when the following day opens higher, also plots the exit signal when the RSI is lower than the previous day RSI and of opens lower.
declare lower;
plot signal=RSI()."RSI" crosses above 25 and low crosses below BollingerBands()."LowerBand" within 4 bars;
plot exit=RSI()."RSI" is less than RSI()."RSI" from 1 bars ago and high crosses above BollingerBands()."UpperBand" within 4 bars;
This is to identify possible reversal on Bollinger Bands, How can I implement into a Scanner that found stocks that are touching the bollinger Bands on the Dailychart with a possible of reversal?
someone can help me?
thanks


