Hi I have a question on how to code something in Welkin's AVI. Here is the link to the thread for the script https://usethinkscript.com/threads/advanced-volume-indicator-for-thinkorswim.1665/
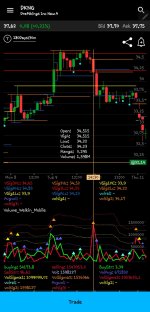
My question is about the buy/sell str for the second aggregation. First off let me just present two images so you know what I'm talking about.
Here is the indicator with the second aggregation turned off:

And here is the indicator with the second aggregation turned on:

My question is, is it possible to have some kind of percentage present in the second image that indicates the percentage of buy vs sell shown in the clouds? For example in that image from 6:30 - 7:00 it would show something like "95% buy/5% sell", then at 7:01 it would show "60% buy/40% sell". Something like that. I would prefer this also be favorable to backtesting. In other words, have the percentages present not only at the most current data but historical data as well.
Also along similar lines, I also would like to change the watchlist column in Welkin's post to show the buy/str for an aggregate (15m, for example) instead of just current bars. Here is the code in the thread for the watchlist:
I wish Welkin was around to answer these questions but he's been inactive for several months now. If anyone knows how to code these things, please let me know. Thanks in advance.
My question is about the buy/sell str for the second aggregation. First off let me just present two images so you know what I'm talking about.
Here is the indicator with the second aggregation turned off:
And here is the indicator with the second aggregation turned on:
My question is, is it possible to have some kind of percentage present in the second image that indicates the percentage of buy vs sell shown in the clouds? For example in that image from 6:30 - 7:00 it would show something like "95% buy/5% sell", then at 7:01 it would show "60% buy/40% sell". Something like that. I would prefer this also be favorable to backtesting. In other words, have the percentages present not only at the most current data but historical data as well.
Also along similar lines, I also would like to change the watchlist column in Welkin's post to show the buy/str for an aggregate (15m, for example) instead of just current bars. Here is the code in the thread for the watchlist:
Code:
#Buy/Sell Strength Column
def o = open;
def h = high;
def l = low;
def c = close;
def PR = h - l;
def BuyStr = ((c - l) / PR) * 100;

AddLabel(1,Round(BuyStr,1)+" | " + Round(100-BuyStr,1)+"%", Color.BLACK);

AssignBackgroundColor(if BuyStr >= 70 then Color.Green else if BuyStr > 50 then Color.DARK_GREEN else if BuyStr <= 30 then Color.RED else if BuyStr < 50 then Color.DARK_RED else Color.GRAY);
I wish Welkin was around to answer these questions but he's been inactive for several months now. If anyone knows how to code these things, please let me know. Thanks in advance.


