#Created By Brent Vogl (Wannaspeed, Brent V)
#Do not Distribute without Creator's Permission
#Do you love my indicator? Help me out with a paypal donation by copy/Paste the link below!
#Paypal Donate: https://www.paypal.com/cgi-bin/webscr?cmd=_s-xclick&hosted_button_id=4CRL8BNAESUHW&source=url
#Date created 11/19/19
#Version 2.1
#Shows Estimated Halt High or Halt Low
################ Inputs (choose what you want to display)
Input showPriorclose = yes;
Input showFiveMinutePrice = yes;
Input showHaltHighPlot = yes;
Input showHaltLowPlot = yes;
#input lowLimit = 0.75;
#input highLimit = 3;
################ Prior Close Price
def aggregationPeriod = AggregationPeriod.DAY;
def displace = -1;
def Priorclose =close(period =aggregationPeriod)[-displace];
################ Definitions
def isopen=if secondsFromTime(0945)>=0 and secondstillTime(1535)>=0 then 1 else 0;
#def beforeStart = GetTime() < RegularTradingStart(getYYYYMMDD());
#def isopen=if secondsFromTime(0930)>=0 and secondstillTime(0945)>=0 and secondsFromTime(1535) and secondsTillTime(1600) then 1 else 0;
def FiveMinPrice = close(period = AggregationPeriod.min)[5];
Def HaltHigh = (if isopen then FiveMinPrice * 1.10 else FiveMinPrice *1.20);
Def HaltLow = if isopen then FiveMinPrice / 1.10 else FiveMinPrice /1.20;
Def HaltHighBetween = (if isopen and priorclose between .75 and 3 then FiveMinPrice * 1.20 else FiveMinPrice *1.40);
Def HaltLowBetween = if isopen and priorclose between .75 and 3 then FiveMinPrice / 1.20 else FiveMinPrice /1.40;
Def HaltHighUnder = if isopen and priorclose is less than 0.75 then FiveMinPrice * 1.75 else FiveMinPrice *2.5;
Def HaltLowUnder = if isopen and priorclose <= 0.75 then FiveMinPrice / 1.75 else FiveMinPrice /2.5;
Def HaltHigh15 = if isopen and priorclose <= 0.75 then fiveMinPrice + 0.15 else fiveMinPrice + 0.30;
Def HaltLow15 = if isopen and priorclose <= 0.75 then fiveMinPrice - 0.15 else fiveMinPrice - 0.30;
################ Labels & Plots
Addlabel (showPriorclose, + Priorclose, color.dark_GRAY);
Addlabel (ShowFiveMinutePrice, + FiveMinPrice, color.DaRK_GRAY);
Addlabel (Priorclose >=3, HaltHigh, color.light_GREEN);#For stocks over $3
#Addlabel (yes, HaltHigh, color.light_GREEN);
Addlabel (Priorclose between 0.75 and 3, HaltHighBetween, color.light_GREEN);#For stocks between .75-3
Addlabel (Priorclose between 0.75 and 3, HaltLowBetween, color.pink);#For stocks between .75-3
Addlabel (Priorclose >=3, HaltLow, color.pINK); #Fors stocks over $3
#Addlabel (Priorclose <=0.75, HaltHighUnder, color.light_Green); #Fors stocks under .75
Addlabel (Priorclose <=0.75, if HaltHighUnder > HaltHigh15 then HaltHigh15 else haltHighUnder, color.light_Green); #Stocks under .75
#Addlabel (Priorclose <=0.75, HaltLowUnder, color.pINK); #Fors stocks under .75
Addlabel (Priorclose <=0.75, if HaltLowUnder < HaltLow15 then HaltLow15 else haltLowUnder, color.pink);#Stocks Under .75 ###check
#Addlabel (yes, HaltLow, color.pINK);
plot HHighOver3 = if ShowHalthighPlot > 0 and Priorclose >=3 then Halthigh else Double.NaN;
plot HLowOver3 = if ShowHaltLowPlot > 0 and Priorclose >=3 then HaltLow else Double.NaN;
plot HhighBEtween = if ShowhaltHighPlot > 0 and between(PriorClose, .75, 3) then HaltHighBetween else Double.NaN;
#plot HHighBetween = if ShowhaltHigh > 0 and priorclose >= lowLimit and priorclose <= highLimit then HaltHighBetween else Double.NaN;
plot HLowBEtween = if ShowhaltLowPlot > 0 and between(PriorClose, .75, 3) then HaltLowBetween else Double.NaN;
#plot HHighUnder = if ShowhaltHighPlot > 0 and Priorclose <= .75 then HaltHighUnder else Double.NaN;
plot HHighUnder = if ShowhaltHighPlot > 0 and Priorclose <= 0.75 then Min(HaltHighUnder, HaltHigh15) else Double.NaN;
#plot HLowUnder = if ShowhaltLowPlot > 0 and Priorclose <= 0.75 then HaltLowUnder else Double.NaN;
plot HLowUnder = if ShowhaltLowPlot > 0 and Priorclose <= 0.75 then Max(HaltLowUnder, HaltLow15) else Double.NaN;###Check
############
It only works on a 1 minute chart, because of limitations with the aggregation period. I don't know if there's a different way to find out the price for 5 minutes ago on other chart time periods. but if anyone knows how I can try to implement it.
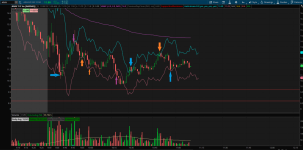
By default it shows yesterday's close price, and the close price from 5 mins ago. These can be turned off. It has an upper and lower halt indicator in light green and pink, It also shows an upper/lower Plot by default, which can also be turned off individually. Just because the price touches or overlaps the halt price does not mean the stock will halt, it has to stay at that level for 15 seconds. Also the stock may halt if there's huge volatility between the bid and the ask. This Indicator only compares the close price 5 mins ago to the current price, so it's only a guideline (though it should be pretty accurate). This indicator will not work for tier 1 stocks, though I don't think this is too necessary because they rarely have Volatility Halts. I may try to implement a daily average volume parameter that factors the lower 5/10% for tier 1 stocks at a later date, but its low priority for me because I rarely trade them.
This Indicator does take into account the first 15 minutes of the day and the last 25 minutes, and increases the ranges respectively. It also factors in the price (over $3, Between .75-3 and under .75) and will do the lesser of either 15/30 cents or 75%/150% for stocks under .75. It does continue to show the Halt prices, and plots for Premarket and Post market although there are no halts during this time. I will try to implement a toggle to disable for Aftermarket hours.
I have no idea the characteristics of the Halt indicator during the first 5 minutes of market open. I'm not sure how the SEC handles it either... (is it based on Open price or premarket prices? This indicator will be based on premarket data. Though Im sure it could be adapted if it needs different data during this period. Anyway, if you have any questions, tips, or notice any bugs or odd behavior feel free to let me know.
Well it seems to work well, its accurately detected 2 halts so far this morning. Only thing I noticed is the bars wont be accurate for 5 minutes after a halt, since TOS doesn't count the time halted as 1 min bars. I'm not sure how to get around that. Only thing I could think of is if volume is 0 for 3 minutes then start counting from last price until volume resumes and 5 minutes passes. Unfortunately my thinkscript coding skills at the moment are not advanced enough to implement that sort of condition.
Just so i get it right, the price needs to touch and hold the halt price shown in the labels/plot for at least 15 seconds but only if it happens within the current 1min bar right? Or do i misunderstand it then?
Just so i get it right, the price needs to touch and hold the halt price shown in the labels/plot for at least 15 seconds but only if it happens within the current 1min bar right? Or do i misunderstand it then?
There's a certain amount of leeway around the lines, but yes once the current price starts touching the indicator line, and maybe in some cases is close to it you need to start thinking of a potential halt. Since the indicator is only updated every minute and not real time as in the case of the SEC triggers its only a close guideline and there will be slight variances. But the general idea is if a stock moves X % in a rolling 5 minute period and stays above or below X for 15 secs it will halt. I hope that clears it up.
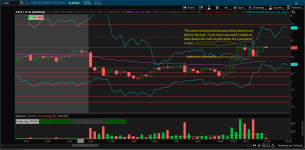
EDIT: If you look at ARAV has halted 2 times so far today, there was a couple times it dipped into the halt indicator but wasn't halted. And comparing it to the other Halt stock I posted earlier, it got deeper into the line before a halt. The Blue arrows are areas where it touched or crossed the halt line but didn't halt. I think there's more flexibility near market open because there's a lot of volatility and price discovery. The purple arrows are where it did halt. Keep in mind right after a halt the information won't be very accurate for about 5 mins. The orange arrows are where the stock played around in the indicator but not long enough, and the last orange arrow I attribute to the delayed nature of the indicator. When I looked at a 10 second chart the price fluctuations from the previous 5 minutes put it between 9-10% depending on which part of the candle you look at. Which is definitely getting close to being halted but apparently not quite enough. I think the SEC must take into account a bit more than ONLY price movement. In the end it's a tool that can only signal a potential halt, not a guaranteed halt. And I'm sure with more experience with the indicator and halted stocks the behavior will be more easily identified by the end user.
I had to tweak the code on the indicator for stocks that closed under .75 cents. basically just had to swap < for > in a couple areas because it was choosing the wrong formula to plot/indicate. The updated Indicator is here https://tos.mx/AQBubMo
Also updated the original post source code and added link to the new Indicator.
Also if anyone could help with code to make the indicator stop using 5 minutes after a halt resumes that would be appreciated. I was thinking the indicator could check volume, and if less than 0 use last price. then once volume > 0 continue using halt resume price for 5 minutes then switch back to the normal previous 5 minute price. Or if anyone has a better idea, i'm all ears.
Basically what happens is when a stock halts thinkorswim stops counting ticks as minutes so it's still using the price from before the halt, but it should be using the halt resumed price until 5 mins passes. The price difference from 5 minutes before a halt and right after a halt can be significant.
EDIT: On second thought, I'm not sure if volume would work, or tickcount or whatever since it would just look at the last candle for the data. Hmmm, not sure how to make it detect a halt..... unless it's something like if tick count, volume or whatever is unchanged for 3 minutes then wait until tick changes. Not sure if that's possible? Any ideas?
@Wannaspeed, this is amazing and much appreciated, thanks! I have yet to trade it/make money with it, but would love to make a donation once I do ..
In the mean time and in order to get there (and hopefully other participants to this thread) ; I wanted to ask if anyone knew how to setup a custom scanner to narrow down a list of potential stocks that are good candidates to be halted shortly (hence the 8%, and 16 % below respectively instead of the 10 % and 20% at which the stocks would be halted).. so as to have a look at these stocks from the watchlist using your indicator above on the chart...
a simplified version of the conditions would be :
Scan for either:
1) last price is higher or equal to $3 AND the high of the current 1 min candle is at least 8% higher than the low of any of the last 4 candles (1 min)
OR
2) last price is lower then $3 AND the high of the current 1 min candle is at least 16% higher than the low of any of the last 4 candles (1 min)
Appreciate any hints or help you might be able to provide..
Thanks for the positive feedback. I plan at some point to add a visual for the amount the indicator is looking for with each stock. So if it's a 10% move or 20% 15 cents etc. This way immediately after a halt it can at least be somewhat manually calculated.
I already pretty much know for myself the amount since I had to do a lot of research on order to create the indicator but I think it would be helpful for others that aren't as familiar with what causes stocks to halt.
As far as a scanner to find stocks about to halt, I usually find them with momentum scanners, but I think it's doable to enter a criteria that will find them within TOS. It could be closely built on my scanner settings but instead of 15 cents,10, 20, 40% move in 5 mins it could be like 12 cents 7, 15, 35%. Something close enough to find the stocks moving but not kick out too many stocks. The only bad thing about TOS scanners is when using custom scans they have a delay, and from what I've heard the only way around it is to spam the scan button and even then you have delay from when it populates and from when you can scan again. IMO using TOS to scan for fast moving stocks isnt ideal, there are much better (faster) scanners out there.
I'm new to thinkscript so my code might not be ideal, but I wrote a script to calculate how many minutes each halt was. The code below will display a bubble on bars to show how many minutes the previous bar was halted.
I believe it may help calculate the 5 minutes after a halt in @Wannaspeed's script. Unfortunately, it's beyond my ability to combine them, but hopefully someone more skilled can make it work.
Btw, this can be modified to show the halt on the actual bar the halt happened if interested, but I thought the current code might apply more directly to fixing the 5 minutes post-halt.
Edit: see this code below instead to show likely halts on the bar it actually happened.
Code:
# Halt length detector by LennyP (Some lines credit to tomsk & RobertPayne)
# Indicates how many minutes the halt on previous bar was
# Works on 1 min chart only

declare hide_on_daily;
input Starttime = 0930;
input Endtime   = 1600;

def Active = SecondsFromTime(Starttime) >= 0 and SecondsTillTime(Endtime)-1 >= 0;
def Today  = GetDay() == GetLastDay();
def isMinuteAgg = (GetAggregationPeriod() == AggregationPeriod.MIN);
def Qualifies = Active and Today and isMinuteAgg;

def MinFromStart = rounddown(SecondsFromTime(Starttime)/60,0);

def minutesHalted = if Qualifies
    and MinFromStart > MinFromStart[1] + 1    #if current bar > 1min from previous bar
    then MinFromStart - MinFromStart[1]       #difference in minutes
    else 0;

AddChartBubble(if Qualifies
    and MinFromStart > MinFromStart[1] + 1
    then 1 else 0, high, minutesHalted + " min Halt", Color.orange, yes);

#############
Using the script above, I also noticed some stock charts have what appear to be 2 minute halts, occasionally other odd lengths. It doesn't seem to be an actual halt, but there are missing minutes in these charts. For example one bar might be at 10:30am and the next will be at 10:32am. I am confused by this. Not sure if its a bug in thinkorswim, or there is some other reason. But I assume the code above may also help in those situations. I'll attach an image as an example:
edit - ver 5 (5/3/20): redefined a halt as any gap between bars of 5 mins or more & minor adjustments
edit - ver 4: added painting downbar and upbar halt candles different colors and simplified some code
Code:
# Halt length detector ver. 5 by LennyP (Some lines credit to tomsk & RobertPayne)
# Indicates likely halts and how many minutesHalted it was (after halt has ended)
# Works on 1 min chart only

#hint Show_Bubbles:Show bubbles above likely halts
#hint Halt_Bubble_Text:Text in bubble following number of minutes
#hint Paint_Halt_Bars:Paint_Halt_Bars bars of likely halts different colors
declare hide_on_daily;
declare once_per_bar;

input Show_Today_Only = Yes;
input Show_Bubbles = Yes;
input Halt_Bubble_Text = "min";
input Paint_Halt_Bars = No;
input Starttime = 0930;
input Endtime   = 1600;

def Active = SecondsFromTime(Starttime) >= 0 and SecondsTillTime(Endtime) - 1 >= 0;
def Today  = GetDay() == GetLastDay();
def isMinuteAgg = (GetAggregationPeriod() == AggregationPeriod.MIN);
def MinFromStart = RoundDown(SecondsFromTime(Starttime) / 60, 0);
def Qualifies = if Show_Today_Only then Active and Today and isMinuteAgg else Active and isMinuteAgg;

def minutesHalted = if Qualifies
    and MinFromStart[-1] > MinFromStart + 1    #if next bar > 1min from current bar
    then MinFromStart[-1] - MinFromStart       #difference in minutes
    else 0;

def LikelyHalt = minutesHalted >= 5;

AddChartBubble(Qualifies and Show_Bubbles and LikelyHalt, high, minutesHalted + Halt_Bubble_Text, Color.YELLOW, yes);

assignPriceColor (if Qualifies and Paint_Halt_Bars and LikelyHalt and close > open then Color.light_green else
    if Qualifies and Paint_Halt_Bars and LikelyHalt and close < open then color.pink else Color.CURRENT);

#################
Thanks @Len20 for the modified version!
I tried it today and for some reason, when there is a halt, the chart bubble does not appear right away. From what i could see, the bubble appeared after the un-halt so was wondering if you have noticed the same thing?
Was also wondering if you could add an option to paint the current halt bar in a custom color instead of the chart bubble next to the halt bar?
Sure no problem. Oh yeah, I forgot to mention that. The way it works, it looks for a gap of 2 mins or more between bars (should only be 1 min on 1 min chart). It doesn't know there was a halt until after a new bar starts and it counts 2 or more mins, so unfortunately it doesn't indicate it until then. I don't think it's possible to detect it on a live bar, but I am still learning thinkscript so I hope I'm wrong and someone else can do it.
Btw on some charts there are many gaps of odd times like 2 mins, 3mins, 8mins etc. This script considers these "questionable halts" because as I understand, real halts should be 5, 10 or 15min. exactly in most cases. I honestly have no idea why these multi-minute gaps are on these charts, and hopefully someone more knowledgeable can inform us. They can be hidden, though some of them may be 5 or 10 min and not be a real halt, so consider this script just a guess, and mostly right about the real halts.
I have update the code above to add bar painting and bubbles as options.
Btw on some charts there are many gaps of odd times like 2 mins, 3mins, 8mins etc. This script considers these "questionable halts" because as I understand, real halts should be 5, 10 or 15min. exactly in most cases. I honestly have no idea why these multi-minute gaps are on these charts, and hopefully someone more knowledgeable can inform us. They can be hidden, though some of them may be 5 or 10 min and not be a real halt, so consider this script just a guess, and mostly right about the real halts.
On another note, I've been trying to combine my halt detector with Wannaspeed's indicator, so that it can try to get the 5 minutes after a halt more accurate. My thinkscripting is just okay but improving (still a novice) but the real hurdle hasn't been coding. It's trying to understand what exactly the reference price is after a halt or on opening. The limit bands are based off of this reference. Lines like this throw me off:
The first Reference Price for a trading day is the Opening Price on the Primary Listing Exchange if such price occurs less than five minutes after the start of regular trading hours. If the Opening Price on the Primary Listing Exchange does not occur within five minutes after the start of trading hours, the first Reference Price is the arithmetic mean of eligible reported transactions over the preceding five minutes.
Being a newbie, I'm wondering how to determine if there is no opening price. My assumption is to check for no volume in the opening minutes, but I'm not sure if that's the meaning. Then, if no volume, what exactly is the arithmetic mean of those 5min of transactions?
So I thought I just need a moving average during the first 5 minutes, but I learned that a moving average only averages the close of each bar. It doesn't seem to be an average of all of the transactions as described in the LULD FAQ. I'm wondering if a closer approach would be to use the midpoint of each bar and then average those numbers out during the first 5 minutes. Actually, the same "arithmetic mean of eligible transactions" terminology is used to describe how to calculate the reference price throughout the whole trading day. If anyone has any insight on how get get a more accurate reference price, that would be great, or else I'll just do my best to be close.
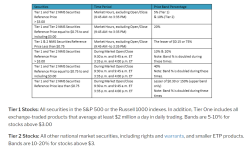
Btw, in studying the documentation, I found that the formula has changed a bit since Wannaspeed posted his script. There was an "Amendment 18" that apparently took effect Feb 2020 that removed the doubling of the limit bands from 9:30 to 9:45, and some of the doubling from 3:35 till close. Here is some info for those interested or just google "LULD Limit Up Limit Down" I'll attach some sample screenshots here:
If I manage to complete this script successfully, it will include the updated price bands, unless a better coder can beat me to it.
Here is my code for an updated Halt Estimate Indicator for Tier 2 Stocks. Thanks to @Wannaspeed for the original solution! Btw I am only a novice so my coding may not be following best practices, but I spent a lot of time trying to follow the LULD Rules here and here to my ability & it seems to work pretty well. Please improve/fix anything that needs it.
This has been updated for the new February 2020 Limit Up Limit Down halt rules. They eliminated the doubling of the bands from 9:30 to 9:45, and also changed the doubling rules slightly from 3:35-4pm. I tried to follow all of the halt rules, and it also works during the 5 minutes after a halt.
It is somewhat future proof in case they change the rules again. The percentages, hours, and price ranges are adjustable near the top of the code. So, for example, there is now no doubling in the first 15min of opening, but if they change that back, you can just type in the new changeover time for "normal_Hours_Start". The "930" could be changed back to "945" and the new percentages for the opening period would need to be changed below. You can also update price boundaries (the changeover price for what they consider a low, mid, or high priced stock) if that changes.
Because of limits of thinkscript data, there are limits to accuracy of the estimated halt price. Here are some of the major obstacles I encountered:
(1) Determining the average price for transactions over the last 5 minutes
- We don't (to my knowledge) have access to the real average price a stock traded at in a given 1-minute bar, so I estimate it as (high+low)/2, the midpoint of the bar. For example, if a bar has 95% of its transactions near the low, and only 5% near the high, the estimate will be off.
(2) 30 Seconds Reference Price rule: "The reference price will only be updated if the new reference price is at least 1% away in either direction from the current. Each new Reference Price shall remain in effect for at least 30 seconds."
- We only have access to minute chart data, so reference prices that are held for 30 seconds are impossible to get exactly right. We could be updating the reference when we shouldn't or vice-versa. For example if a new bar starts with a huge move, we don't know if we are within the 30 second hold. If we are, the current price band should stay put. If not, it should update based on the current bar's movement (in addition to the previous 5 min of bars).
(3) Previous 5 Minutes
- The definition of previous 5 minutes seems to be a live rolling 5 minute period. Since we can access only full minute bar data, this won't be totally accurate either.
Given these limitations, for each bar there are 2 estimated halt prices calculated for the upper band and 2 for the lower band. One uses the midpoint of the current bar in the calculation, and the more conservative one assumes the current bar's price spent more time inward, closer to the reference. Other considerations are also calculated.
There are 3 display modes:
Range - Shaded area between the two calculated halt estimates of each band
Line - A line of the conservative halt estimate for each band
Area - Shades the entire area above the upper conservative band, and below the lower conservative band
I personally prefer Range. With it I have a better idea of where a halt is likely to occur.
Remember this indicator is just an estimate. A halt may (and will) sometimes occur before the price reaches a band, or it may not occur even though price has reached a band. It seems a halt also requires the price to touch the real band for 15 seconds for a halt to occur, so that may cause some misses too.
Btw the bubbles showing actual halts are a separate script I created here. It only shows the length of a likely halt after a new bar after the fact. I like using them both together.
1-MINUTE CHART ONLY
TIER 2 STOCKS ONLY. Not accurate on tier 1 (S&P 500, Russell 1000 stocks)
Range
Line
Area
Code:
# LULD Halt Estimate Indicator 1.01 by Lenny
# - various code concepts from multiple posts at Usethinkscript.com

# v1.0  5/2/20  -original
# v1.01 6/9/20  -minor fix in situation where there is no lower band

# 1-MINUTE CHART ONLY
# TIER 2 STOCKS ONLY. Not accurate on tier 1 (S&P 500, Russell 1000 stocks)
# Works with 3 (or less) stock price ranges (Low, Mid, High)
# Works with 3 (or less) time periods for each price range (Open, Normal, Close)
#   (If opening and/or closing hours are not used, enter same time and boundries as normal hours)
declare hide_on_daily;

#=================  INPUTS  =================#

input display_Mode = {default Range, Line, Area};
input show_today_only = yes;
input show_labels = yes;

# Hour ranges (enter duplicate of normal hours if no opening or closing hours difference)
input open_Time  = 0930;
input normal_Hours_Start = 0930;
input normal_Hours_End = 1535;
input close_Time = 1600;

# Adjust bands very slightly inward for margin of error
# (by default 1% of the difference between ref price and band)
def Estimate_Adjustment_Percent = 1;    # 1% recommended


#==========  BOUNDRIES AND LIMITS  ==========#

# Price range boundries (Low/Mid, Mid/High priced stocks)
def LowPriceMax = .75;
def MidPriceMax = 3.00;

# Low-priced stocks percentage / dollar(alt) limit bands
def LowPriceOpenPercent   = 75;        # Will choose lower of percent and dollar value
def LowPriceOpenAlt       = .15;
def LowPriceNormalPercent = 75;        # Will choose lower of percent and dollar value
def LowPriceNormalAlt     = .15;
def LowPriceClosePercentUp   = 150;    # upper and lower have different rules for low priced stocks (currently)
def LowPriceCloseAltUp       = .30;    # Will choose lower of percent and dollar value
def LowPriceClosePercentDown = 0;      # 0 = no limit, no lower band needed (currently)
def LowPriceCloseAltDown     = 0;      # 0 = no limit, no lower band needed (currently)

# Mid-priced stocks percentage limit bands
def MidPriceOpenPercent   = 20;
def MidPriceNormalPercent = 20;
def MidPriceClosePercent  = 40;

# High-priced stocks percentage limit bands
def HighPriceOpenPercent   = 10;
def HighPriceNormalPercent = 10;
def HighPriceClosePercent  = 10;

# Minimum reference price change (%)
def RefMinChangePercent = 1;            # must move 1% to move bands (LULD rules)


#================= DEFs =====================#

def Active = SecondsFromTime(open_Time) >= 0 and SecondsTillTime(close_Time) - 1 >= 0;
def Today  = GetDay() == GetLastDay();
def isMinuteAgg = (GetAggregationPeriod() == AggregationPeriod.MIN);
def Qualifies = if show_today_only then Today and Active and isMinuteAgg else Active and isMinuteAgg;
def FirstBar = Active == 1 and Active[1] == 0;
def CurrentMinute = RoundDown(SecondsFromTime(open_Time) / 60, 0) + 1;
def MinFromPrevBar = CurrentMinute - CurrentMinute[1];
def PriorClose = close(period = AggregationPeriod.DAY)[1];
def lastBarClose = close[1];
def ExtendBar1 = FirstBar[1] and IsNaN(close) and !IsNaN(close[1]); #1st bar bands will extend to right so 1st bar is visible live

def LowPriced = PriorClose < LowPriceMax;
def MidPriced = PriorClose >= LowPriceMax and PriorClose <= MidPriceMax;
def HighPriced = PriorClose > MidPriceMax;
def OpeningHours = SecondsFromTime(open_Time) >= 0 and SecondsTillTime(normal_Hours_Start) > 0;
def NormalHours  = SecondsFromTime(normal_Hours_Start) >= 0 and SecondsTillTime(normal_Hours_End) > 0;
def ClosingHours = SecondsFromTime(normal_Hours_End) >= 0 and SecondsTillTime(close_Time) > 0;


#======= CALCULATE REFERENCE ESTIMATES =======#

def vol = volume;
def histAvgPrice = hl2;
def histAvgPriceVol = histAvgPrice * vol;

def Bar0AvgPriceUp    = (open + low) / 2;        # Bar0 = current bar
def Bar0AvgPriceVolUp = Bar0AvgPriceUp * vol;
def Bar0AvgPriceLw    = (open + high) / 2;
def Bar0AvgPriceVolLw = Bar0AvgPriceLw * vol;
def Bar0AvgPriceHL2   =  hl2;
def Bar0AvgPriceHL2Vol = Bar0AvgPriceHL2 * vol;

def Bar1AvgPriceVol = histAvgPriceVol[1];
def Bar2AvgPriceVol = histAvgPriceVol[2];
def Bar3AvgPriceVol = histAvgPriceVol[3];
def Bar4AvgPriceVol = histAvgPriceVol[4];
def Bar5AvgPriceVol = histAvgPriceVol[5];

def Bar0Within5Min = 1;
def Bar1Within5Min = CurrentMinute[1] >= CurrentMinute - 4 and CurrentMinute[1] > 0;
def Bar2Within5Min = CurrentMinute[2] >= CurrentMinute - 5 and CurrentMinute[2] > 0;
def Bar3Within5Min = CurrentMinute[3] >= CurrentMinute - 5 and CurrentMinute[3] > 0;
def Bar4Within5Min = CurrentMinute[4] >= CurrentMinute - 5 and CurrentMinute[4] > 0;
def Bar5Within5Min = CurrentMinute[5] >= CurrentMinute - 5 and CurrentMinute[5] > 0;

def totalAvgPriceVolUp =
    (Bar0AvgPriceVolUp * Bar0Within5Min) + (Bar1AvgPriceVol * Bar1Within5Min) + (Bar2AvgPriceVol * Bar2Within5Min) +
    (Bar3AvgPriceVol * Bar3Within5Min) + (Bar4AvgPriceVol * Bar4Within5Min) + (Bar5AvgPriceVol * Bar5Within5Min);
def totalAvgPriceVolLw =
    (Bar0AvgPriceVolLw * Bar0Within5Min) + (Bar1AvgPriceVol * Bar1Within5Min) + (Bar2AvgPriceVol * Bar2Within5Min) +
    (Bar3AvgPriceVol * Bar3Within5Min) + (Bar4AvgPriceVol * Bar4Within5Min) + (Bar5AvgPriceVol * Bar5Within5Min);
def totalAvgPriceVolHL2 =
    (Bar0AvgPriceHL2Vol * Bar0Within5Min) + (Bar1AvgPriceVol * Bar1Within5Min) + (Bar2AvgPriceVol * Bar2Within5Min) +
    (Bar3AvgPriceVol * Bar3Within5Min) + (Bar4AvgPriceVol * Bar4Within5Min) + (Bar5AvgPriceVol * Bar5Within5Min);
def totalVol =
    (vol * Bar0Within5Min) + (vol[1] * Bar1Within5Min) + (vol[2] * Bar2Within5Min) +
    (vol[3] * Bar3Within5Min) + (vol[4] * Bar4Within5Min) + (vol[5] * Bar5Within5Min);

def vwapUp  = totalAvgPriceVolUp / totalVol;
def vwapLw  = totalAvgPriceVolLw / totalVol;
def vwapHL2 = totalAvgPriceVolHL2 / totalVol;

#Reference must move at least 1% or previous ref constinues
def RefMinIncDecimal = (RefMinChangePercent  *.01) + 1;
def RefMinDecDecimal = 1 - (RefMinChangePercent  *.01);
def RefPriceUp =
    if (FirstBar or MinFromPrevBar >= 5) then Bar0AvgPriceUp else
    if (vwapUp >= RefPriceUp[1] * RefMinIncDecimal) or (vwapUp <= RefPriceUp[1] * RefMinDecDecimal) then vwapUp else RefPriceUp[1];
def RefPriceLw =
    if (FirstBar or MinFromPrevBar >= 5) then Bar0AvgPriceLw else
    if (vwapLw >= RefPriceLw[1] * RefMinIncDecimal) or (vwapLw <= RefPriceLw[1] * RefMinDecDecimal) then vwapLw else RefPriceLw[1];
def RefPriceHL2 =
    if (FirstBar or MinFromPrevBar >= 5) then Bar0AvgPriceHL2 else
    if (vwapHL2 >= RefPriceHL2[1] * RefMinIncDecimal) or (vwapHL2 <= RefPriceHL2[1] * RefMinDecDecimal) then vwapHL2 else RefPriceHL2[1];


#============= CALCULATE BANDS ==============#

def UpperBand1 =
if LowPriced and OpeningHours then RefPriceUp + Min(RefPriceUp * LowPriceOpenPercent * .01 , LowPriceOpenAlt) else
if LowPriced and NormalHours then RefPriceUp + Min(RefPriceUp * LowPriceNormalPercent * .01 , LowPriceNormalAlt) else
if LowPriced and ClosingHours then RefPriceUp + Min(RefPriceUp * LowPriceClosePercentUp * .01 , LowPriceCloseAltUp) else

if MidPriced and OpeningHours then RefPriceUp + (RefPriceUp * MidPriceOpenPercent * .01) else
if MidPriced and NormalHours then RefPriceUp + (RefPriceUp * MidPriceNormalPercent * .01) else
if MidPriced and ClosingHours then RefPriceUp + (RefPriceUp * MidPriceClosePercent * .01) else

if HighPriced and OpeningHours then RefPriceUp + (RefPriceUp * HighPriceOpenPercent * .01) else
if HighPriced and NormalHours then  RefPriceUp + (RefPriceUp * HighPriceNormalPercent * .01) else
if HighPriced and ClosingHours then  RefPriceUp + (RefPriceUp * HighPriceClosePercent * .01) else Double.NaN;

def UpperBand2 =
if LowPriced and OpeningHours then RefPriceHL2 + Min(RefPriceHL2 * LowPriceOpenPercent * .01 , LowPriceOpenAlt) else
if LowPriced and NormalHours then RefPriceHL2 + Min(RefPriceHL2 * LowPriceNormalPercent * .01 , LowPriceNormalAlt) else
if LowPriced and ClosingHours then RefPriceHL2 + Min(RefPriceHL2 * LowPriceClosePercentUp * .01 , LowPriceCloseAltUp) else

if MidPriced and OpeningHours then RefPriceHL2 + (RefPriceHL2 * MidPriceOpenPercent * .01) else
if MidPriced and NormalHours then RefPriceHL2 + (RefPriceHL2 * MidPriceNormalPercent * .01) else
if MidPriced and ClosingHours then RefPriceHL2 + (RefPriceHL2 * MidPriceClosePercent * .01) else

if HighPriced and OpeningHours then RefPriceHL2 + (RefPriceHL2 * HighPriceOpenPercent * .01) else
if HighPriced and NormalHours then  RefPriceHL2 + (RefPriceHL2 * HighPriceNormalPercent * .01) else
if HighPriced and ClosingHours then  RefPriceHL2 + (RefPriceHL2 * HighPriceClosePercent * .01) else Double.NaN;

def LowerBand1 =
if LowPriced and OpeningHours then RefPriceLw - Min(RefPriceLw * LowPriceOpenPercent * .01 , LowPriceOpenAlt) else
if LowPriced and NormalHours then RefPriceLw - Min(RefPriceLw * LowPriceNormalPercent * .01 , LowPriceNormalAlt) else

if LowPriced and ClosingHours and LowPriceClosePercentDown == 0 and LowPriceCloseAltDown == 0 then 0 else
if LowPriced and ClosingHours and (LowPriceClosePercentDown == 0 or LowPriceCloseAltDown == 0) then
    RefPriceLw - Max(RefPriceLw * LowPriceClosePercentDown * .01 , LowPriceCloseAltDown) else
if LowPriced and ClosingHours then RefPriceLw - Min(RefPriceLw * LowPriceClosePercentDown * .01 , LowPriceCloseAltDown) else

if MidPriced and OpeningHours then RefPriceLw - (RefPriceLw * MidPriceOpenPercent * .01) else
if MidPriced and NormalHours then RefPriceLw - (RefPriceLw * MidPriceNormalPercent * .01) else
if MidPriced and ClosingHours then RefPriceLw - (RefPriceLw * MidPriceClosePercent * .01) else

if HighPriced and OpeningHours then RefPriceLw - (RefPriceLw * HighPriceOpenPercent * .01) else
if HighPriced and NormalHours then  RefPriceLw - (RefPriceLw * HighPriceNormalPercent * .01) else
if HighPriced and ClosingHours then  RefPriceLw - (RefPriceLw * HighPriceClosePercent * .01) else Double.NaN;

def LowerBand2 =
if LowPriced and OpeningHours then RefPriceHL2 - Min(RefPriceHL2 * LowPriceOpenPercent * .01 , LowPriceOpenAlt) else
if LowPriced and NormalHours then RefPriceHL2 - Min(RefPriceHL2 * LowPriceNormalPercent * .01 , LowPriceNormalAlt) else

if LowPriced and ClosingHours and LowPriceClosePercentDown == 0 and LowPriceCloseAltDown == 0 then 0 else
if LowPriced and ClosingHours and (LowPriceClosePercentDown == 0 or LowPriceCloseAltDown == 0) then
    RefPriceHL2 - Max(RefPriceHL2 * LowPriceClosePercentDown * .01 , LowPriceCloseAltDown) else
if LowPriced and ClosingHours then RefPriceHL2 - Min(RefPriceHL2 * LowPriceClosePercentDown * .01 , LowPriceCloseAltDown) else

if MidPriced and OpeningHours then RefPriceHL2 - (RefPriceHL2 * MidPriceOpenPercent * .01) else
if MidPriced and NormalHours then RefPriceHL2 - (RefPriceHL2 * MidPriceNormalPercent * .01) else
if MidPriced and ClosingHours then RefPriceHL2 - (RefPriceHL2 * MidPriceClosePercent * .01) else

if HighPriced and OpeningHours then RefPriceHL2 - (RefPriceHL2 * HighPriceOpenPercent * .01) else
if HighPriced and NormalHours then  RefPriceHL2 - (RefPriceHL2 * HighPriceNormalPercent * .01) else
if HighPriced and ClosingHours then  RefPriceHL2 - (RefPriceHL2 * HighPriceClosePercent * .01) else Double.NaN;

# Adjust bands very slightly inward (by default 1% of the difference between ref price and band)
def EstimateAdj = Estimate_Adjustment_Percent * .01;
def adjustedUpper1 = if UpperBand1 <= UpperBand2 then UpperBand1 - ((UpperBand1  - RefPriceUp)  * EstimateAdj) else UpperBand1;
def adjustedUpper2 = if UpperBand2  < UpperBand1 then UpperBand2 - ((UpperBand2  - RefPriceHL2) * EstimateAdj) else UpperBand2;
def adjustedLower1 = if LowerBand1 >= LowerBand2 and LowerBand1 != 0 then LowerBand1 + ((RefPriceLw  - LowerBand1)  * EstimateAdj) else LowerBand1;
def adjustedLower2 = if LowerBand2  > LowerBand1 and LowerBand2 != 0 then LowerBand2 + ((RefPriceHL2 - LowerBand2)  * EstimateAdj) else LowerBand2;

# Adjust a band when prior bar closed at likely true band limit, but 15 seconds requirement likely carries band over to current bar
def carryOverBand = high == lastBarClose and low == lastBarClose;
def FinalUpper1 = if !FirstBar then if lastBarClose >= adjustedUpper1[1] and carryOverBand and MinFromPrevBar == 1
    then lastBarClose else adjustedUpper1 else adjustedUpper1;
def FinalUpper2 = if !FirstBar then if lastBarClose >= adjustedUpper2[1] and carryOverBand and MinFromPrevBar == 1
    then lastBarClose else Max(adjustedUpper1 , adjustedUpper2) else adjustedUpper2;
def FinalLower1 = if !FirstBar then if lastBarClose <= adjustedLower1[1] and carryOverBand and MinFromPrevBar == 1
    then lastBarClose else adjustedLower1 else adjustedLower1;
def FinalLower2 = if !FirstBar then if lastBarClose <= adjustedLower2[1] and carryOverBand and MinFromPrevBar == 1
    then lastBarClose else Min(adjustedLower1 , adjustedLower2) else adjustedLower2;
def nearestUpper = Min(FinalUpper1, FinalUpper2);
def nearestLower = Max(FinalLower1, FinalLower2);

# 1st bar bands will extend to right 1 bar so 1st bar is visible live
def FinalUpper1Ext  = if ExtendBar1 then FinalUpper1[1] else FinalUpper1;
def FinalUpper2Ext  = if ExtendBar1 then FinalUpper2[1] else FinalUpper2;
def FinalLower1Ext  = if ExtendBar1 then FinalLower1[1] else FinalLower1;
def FinalLower2Ext  = if ExtendBar1 then FinalLower2[1] else FinalLower2;
def nearestUpperExt = if ExtendBar1 then nearestUpper[1] else nearestUpper;
def nearestLowerExt = if ExtendBar1 then nearestLower[1] else nearestLower;

def mode;
switch (display_Mode) {
case Range: mode = 1;      #Range
case  Area: mode = 2;      #Area
case  Line: mode = 3; }    #Line

AddCloud(if Qualifies and mode == 1 then FinalUpper1Ext else Double.NaN, FinalUpper2Ext, Color.GRAY, Color.GRAY, 1);
AddCloud(if Qualifies and mode == 1 then FinalLower1Ext else Double.NaN, FinalLower2Ext, Color.GRAY, Color.GRAY, 1);
AddCloud(if Qualifies and mode == 2 then nearestUpperExt else Double.NaN, Double.POSITIVE_INFINITY, Color.GRAY, Color.GRAY, 0);
AddCloud(if Qualifies and mode == 2 then nearestLowerExt else Double.NaN, Double.NEGATIVE_INFINITY, Color.GRAY, Color.GRAY, 0);

plot Upper_Line = if Qualifies and mode == 3 then nearestUpperExt else Double.NaN;
Upper_Line.SetDefaultColor(Color.GRAY);
Upper_Line.SetStyle(Curve.FIRM);
Upper_Line.HideBubble();

plot Lower_Line = if Qualifies and mode == 3 then nearestLowerExt else Double.NaN;
Lower_Line.SetDefaultColor(Color.GRAY);
Lower_Line.SetStyle(Curve.FIRM);
Lower_Line.HideBubble();

AddLabel(Qualifies and show_labels, "HaltUp: " + AsDollars(nearestUpper) + "  HaltLw: " + (if nearestLower == 0 then "None" else AsDollars(nearestLower)), Color.ORANGE);
useThinkScript is the #1 community of stock market investors using indicators and other tools to power their trading strategies. Traders of all skill levels use our forums to learn about scripting and indicators, help each other, and discover new ways to gain an edge in the markets.
How do I get started?
We get it. Our forum can be intimidating, if not overwhelming. With thousands of topics, tens of thousands of posts, our community has created an incredibly deep knowledge base for stock traders. No one can ever exhaust every resource provided on our site.
If you are new, or just looking for guidance, here are some helpful links to get you started.
VIP members get exclusive access to these proven and tested premium indicators: Buy the Dip, Advanced Market Moves 2.0, Take Profit, and Volatility Trading Range. In addition, VIP members get access to over 50 VIP-only custom indicators, add-ons, and strategies, private VIP-only forums, private Discord channel to discuss trades and strategies in real-time, customer support, trade alerts, and much more. Learn all about VIP membership here.
How can I access the premium indicators?
To access the premium indicators, which are plug and play ready, sign up for VIP membership here.

")