hooptownla
New member
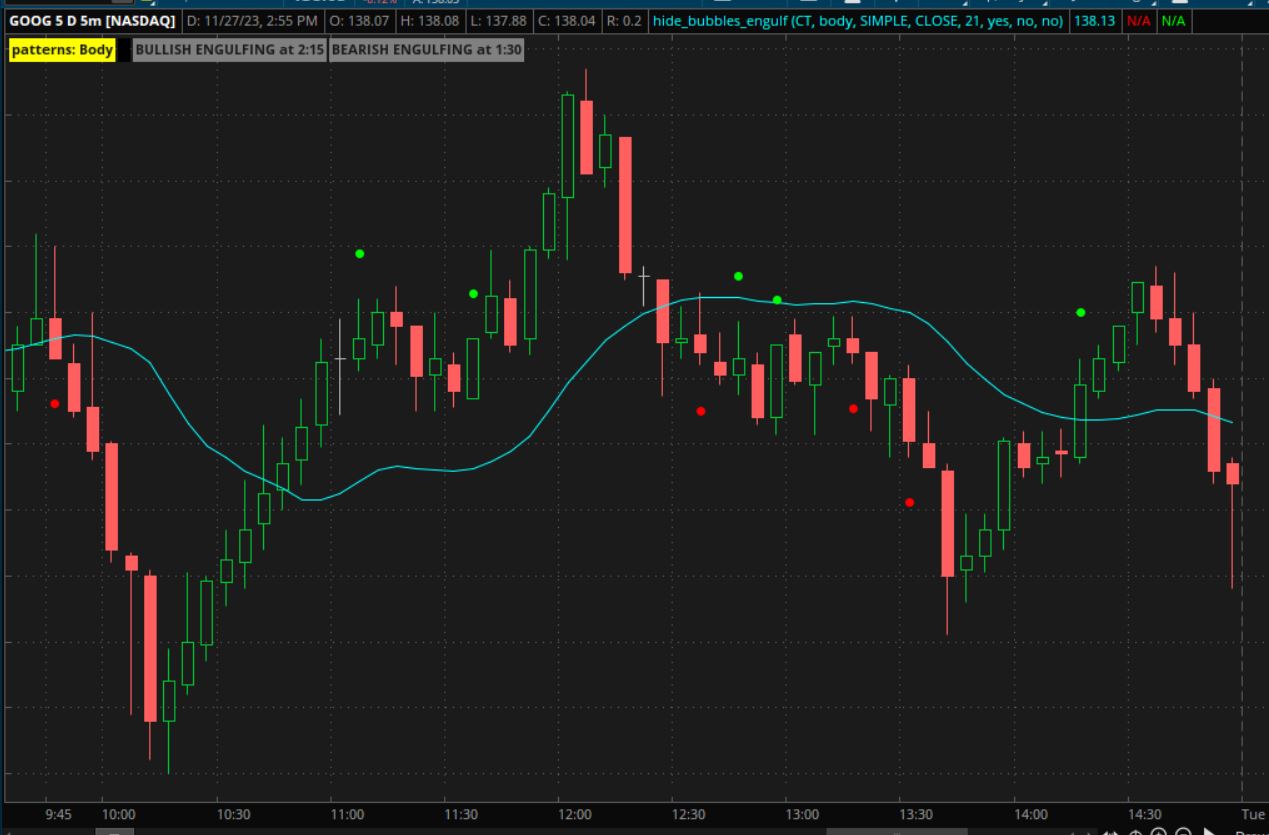
I have this code below and what I really want to accomplish is for the chart bubble is disappear after the next candle since my chart gets too messy with the repeating chartbubble for occurrence of triggers.
In this example of my chart, it shows "ShootingStar" multiple times but what I really want to do is for the "ShootingStar" bubble to disappear after the next candle or if the BearishEngulfing signal is triggered. Help
def ShootingStar = close > open[1] and open < close[1] and close[1] < sma21;
def BearishEngulfing = close < open[1] and open > close[1] and sma21> close[1];
# Display labels on the chart with timestamp
AddLabel(BullishEngulfing, "BULLISH ENGULFING CANDLE is true at " + hour + ":" + (if minutes < 10 then "0" else "") + minutes, if BullishEngulfing then Color.GREEN else Color.BLACK);
AddLabel(BearishEngulfing, "BEARISH ENGULFING CANDLE is true at " + hour + ":" + (if minutes < 10 then "0" else "") + minutes, if BearishEngulfing then Color.RED else Color.BLACK);
# Display bubble chart on the candle where the pattern occurred
AddChartBubble(ShootingStar, low, "ShootingStar", Color.GREEN, yes);
AddChartBubble(BearishEngulfing, high, "Bearish Engulfing", Color.RED, yes);
#
#added AddChartBubble functions to display a message on the candle where the Bullish or Bearish Engulfing pattern occurred.
# Hide the bubble on the next candle
AddChartBubble(ShootingStar[1], low[1], "", Color.UPTICK, yes, no);
AddChartBubble(BearishEngulfing[1], high[1], "", Color.DOWNTICK, yes, no);