Change chart's background based on thinkscript condition?

evanevans

Active member
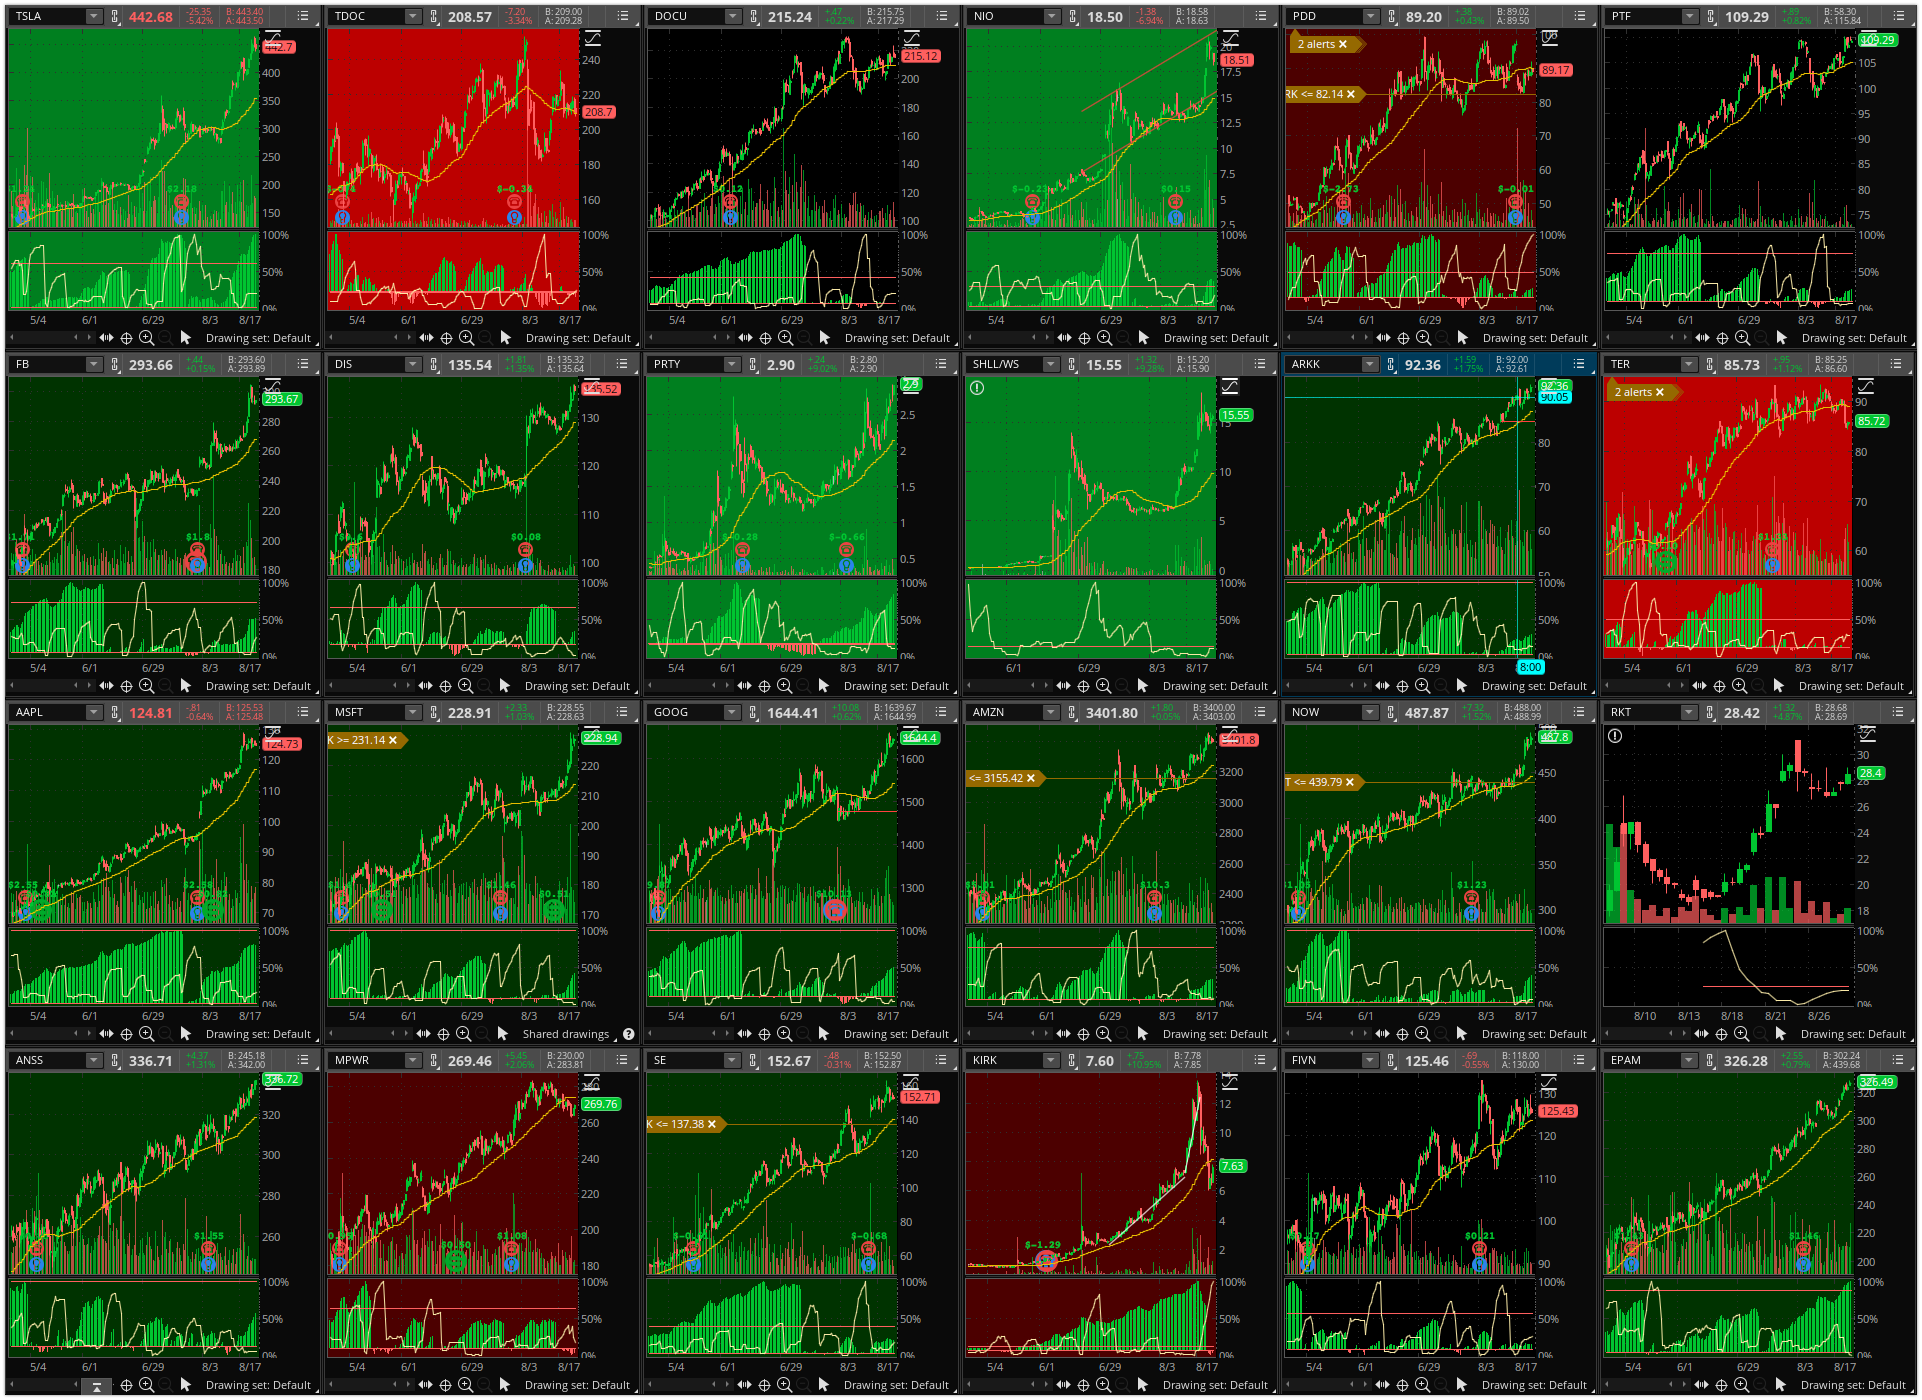
Can the background color of a chart be changed under conditions of a ThinkScript? Or perhaps a full window cloud? It would be great to be able to do this, so I could know which of 100s of charts I monitor simultaneously all day, need my attention.

Something like this:

SJhgVT4.png


I want to create a ThinkScript that can color the background of the whole chart under a particular current condition. I already got this far:

AFyqxt3.png
 
Last edited by a moderator:

Join useThinkScript to post your question to a community of 21,000+ developers and traders.

@evanevans According to the pic, it looks like you want the background color to change based on the relationship between current price and the 20 day SMA. Check if this is right -

Code:
input length = 20;
input avg_type = averagetype.simple;
input agg = aggregationperiod.day;

def c = close(period = agg);
def sma = movingaverage(avg_type,c,length);

DefineGlobalColor("above",GetColor(1));
DefineGlobalColor("below",Color.BLACK);

AssignBackgroundColor(if close > sma
                      then GlobalColor("above")
                      else GlobalColor("below"));


When I started learning thinkscript, I went down many dead-end roads, and still do so frequently. Usually I'm overthinking the code.
 
Awesome guys, thanks for all your help. I'm sure happy with this code, which I have completed:

Code:
#ChartAlert_SMA
#EvanEvans
#V1.0

input aggregationPeriod = AggregationPeriod.DAY;
input SMAPeriod = 20;
input SuperSMAPeriod = 50;
input averageType = AverageType.SIMPLE;
input AlertWhenPercentAboveSMA = 0.050;
input SuperAlertWhenPercentAboveSMA = 0.100;

def c = close(period = aggregationPeriod);
def sma = movingaverage(averageType,c,SMAperiod);
def SuperSMA = movingaverage(averageType,c,SuperSMAperiod);

DefineGlobalColor("SuperAbove",Color.Green);
DefineGlobalColor("Above",Color.Dark_Green);
DefineGlobalColor("Below",Color.Dark_Red);
DefineGlobalColor("SuperBelow",Color.Red);
DefineGlobalColor("default",Color.Current);

AssignBackgroundColor(if close > ((SuperAlertWhenPercentAboveSMA+1) * sma)
                      then GlobalColor("SuperAbove") else if close > ((AlertWhenPercentAboveSMA+1) * sma) then GlobalColor("Above")
                      else if close < SuperSMA then GlobalColor("SuperBelow") else if close < SMA then GlobalColor("Below") else GlobalColor("default"));

If price is 5% above the 20 sma chart changes to dark green
If price is 10% above the 20 sma chart changes to bright green
If price is below the 20 sma chart changes to dark red
If price is below the 50 sma chart changes to bright red

Example in action:
uT1aOE0.png
To change this from SMA to EMA, what would be the change required?
 
Can the background color of a chart be changed under conditions of a ThinkScript? Or perhaps a full window cloud? It would be great to be able to do this, so I could know which of 100s of charts I monitor simultaneously all day, need my attention.

Something like this:

SJhgVT4.png


I want to create a ThinkScript that can color the background of the whole chart under a particular current condition. I already got this far:

AFyqxt3.png
how do i use this, i really want to give it a try. can i have the colors change just at the cross overs not at percentages as that ,makes it harder for me to understand,,,i daytrade, 15mins is the higher time frame maybe go up to a hour, so what should i set this aggregation period be? i use 3 min as entry and 15 mins as my ht
 
how do i use this, i really want to give it a try. can i have the colors change just at the cross overs not at percentages as that ,makes it harder for me to understand,,,i daytrade, 15mins is the higher time frame maybe go up to a hour, so what should i set this aggregation period be? i use 3 min as entry and 15 mins as my ht
If you want to trigger for entry then the aggregation period would be 3min.
 
@evanevans According to the pic, it looks like you want the background color to change based on the relationship between current price and the 20 day SMA. Check if this is right -

Code:
input length = 20;
input avg_type = averagetype.simple;
input agg = aggregationperiod.day;

def c = close(period = agg);
def sma = movingaverage(avg_type,c,length);

DefineGlobalColor("above",GetColor(1));
DefineGlobalColor("below",Color.BLACK);

AssignBackgroundColor(if close > sma
                      then GlobalColor("above")
                      else GlobalColor("below"));


When I started learning thinkscript, I went down many dead-end roads, and still do so frequently. Usually I'm overthinking the code.

@Pensar
I am using simple logic if close > 100sma to assign background green else red. But I am only getting one color for the entire chart regardless whether close > 100sma or not. What am I doing wrong?

input MA = 100;
plot Avg = average(close, MA);
AssignBackgroundColor(if close < Avg then Color.Red else Color.Green);

Is there a way to set the background color for a section of the chart when a condition is met?
 
Last edited by a moderator:
@Pensar
I am using simple logic if close > 100sma to assign background green else red. But I am only getting one color for the entire chart regardless whether close > 100sma or not. What am I doing wrong?

input MA = 100;
plot Avg = average(close, MA);
AssignBackgroundColor(if close < Avg then Color.Red else Color.Green);

Is there a way to set the background color for a section of the chart when a condition is met?

edit
i guess i should have looked at this page,
post #1 has a formula and a cloud , to draw vertical bands of color.
-------------------

if you want to have vertical bands of different colors, you need to use addcloud().

AssignBackgroundColor() Changes the entire background based on the current bar's conditions

https://tlc.thinkorswim.com/center/reference/thinkScript/Functions/Look---Feel/AddCloud
 
Last edited:
I really like this study. However, the bright colors on a chart can be a bit overwhelming. Can I ask if anyone can put this in a label format describing the condition and the matching background color for said condition?
I started with this but I am getting an error referring to the SuperSMA

Code:
AddLabel(yes,
if close > ((SuperAlertWhenPercentAboveSMA + 1) * sma)  then "SuperAbove"
else if
close > ((AlertWhenPercentAboveSMA + 1) * sma) then "Above"
else if
close < SuperSMA then "SuperBelow"
else if
close < sma then "Below"
else
"_",
if  close > ((SuperAlertWhenPercentAboveSMA + 1) * sma)  then GlobalColor("SuperAbove")
else if
close > ((AlertWhenPercentAboveSMA + 1) * sma) then GlobalColor("Above")
else if
close < SuperSMA then GlobalColor("SuperBelow")
else if
close < sma then "Below"
else GlobalColor("default"));

2nd to last line, isn't a color
close < sma then "Below"
 
I really like this study. However, the bright colors on a chart can be a bit overwhelming. Can I ask if anyone can put this in a label format describing the condition and the matching background color for said condition?
I started with this but I am getting an error referring to the SuperSMA

Code:
AddLabel(yes,
if close > ((SuperAlertWhenPercentAboveSMA + 1) * sma)  then "SuperAbove"
else if
close > ((AlertWhenPercentAboveSMA + 1) * sma) then "Above"
else if
close < SuperSMA then "SuperBelow"
else if
close < sma then "Below"
else
"_",
if  close > ((SuperAlertWhenPercentAboveSMA + 1) * sma)  then GlobalColor("SuperAbove")
else if
close > ((AlertWhenPercentAboveSMA + 1) * sma) then GlobalColor("Above")
else if
close < SuperSMA then GlobalColor("SuperBelow")
else if
close < sma then "Below"
else GlobalColor("default"));

This will make the code much easier to read and edit .. :)
Ruby:
def show_SA = close > ((SuperAlertWhenPercentAboveSMA + 1) * sma);
def show_A  = close > ((AlertWhenPercentAboveSMA + 1) * sma);
def show_SB = close < SuperSMA;
def show_B  =  close < sma;

AddLabel( show_SA              , " SuperAbove ",  Color.Green);
AddLabel( show_A and !show_SA  , "   Above    ",  Color.Dark_Green);
AddLabel( show_SB              , " SuperBelow ",  Color.Red);
AddLabel( show_B and !show_SB  , "   Below    ",  Color.Dark_Red);
 
Last edited:

Not the exact question you're looking for?

Start a new thread and receive assistance from our community.

87k+ Posts
375 Online
Create Post

The Market Trading Game Changer

Join 2,500+ subscribers inside the useThinkScript VIP Membership Club
  • Exclusive indicators
  • Proven strategies & setups
  • Private Discord community
  • ‘Buy The Dip’ signal alerts
  • Exclusive members-only content
  • Add-ons and resources
  • 1 full year of unlimited support

Frequently Asked Questions

What is useThinkScript?

useThinkScript is the #1 community of stock market investors using indicators and other tools to power their trading strategies. Traders of all skill levels use our forums to learn about scripting and indicators, help each other, and discover new ways to gain an edge in the markets.

How do I get started?

We get it. Our forum can be intimidating, if not overwhelming. With thousands of topics, tens of thousands of posts, our community has created an incredibly deep knowledge base for stock traders. No one can ever exhaust every resource provided on our site.

If you are new, or just looking for guidance, here are some helpful links to get you started.

What are the benefits of VIP Membership?
VIP members get exclusive access to these proven and tested premium indicators: Buy the Dip, Advanced Market Moves 2.0, Take Profit, and Volatility Trading Range. In addition, VIP members get access to over 50 VIP-only custom indicators, add-ons, and strategies, private VIP-only forums, private Discord channel to discuss trades and strategies in real-time, customer support, trade alerts, and much more. Learn all about VIP membership here.
How can I access the premium indicators?
To access the premium indicators, which are plug and play ready, sign up for VIP membership here.
Back
Top