
evanevans
Active member
Can the background color of a chart be changed under conditions of a ThinkScript? Or perhaps a full window cloud? It would be great to be able to do this, so I could know which of 100s of charts I monitor simultaneously all day, need my attention.
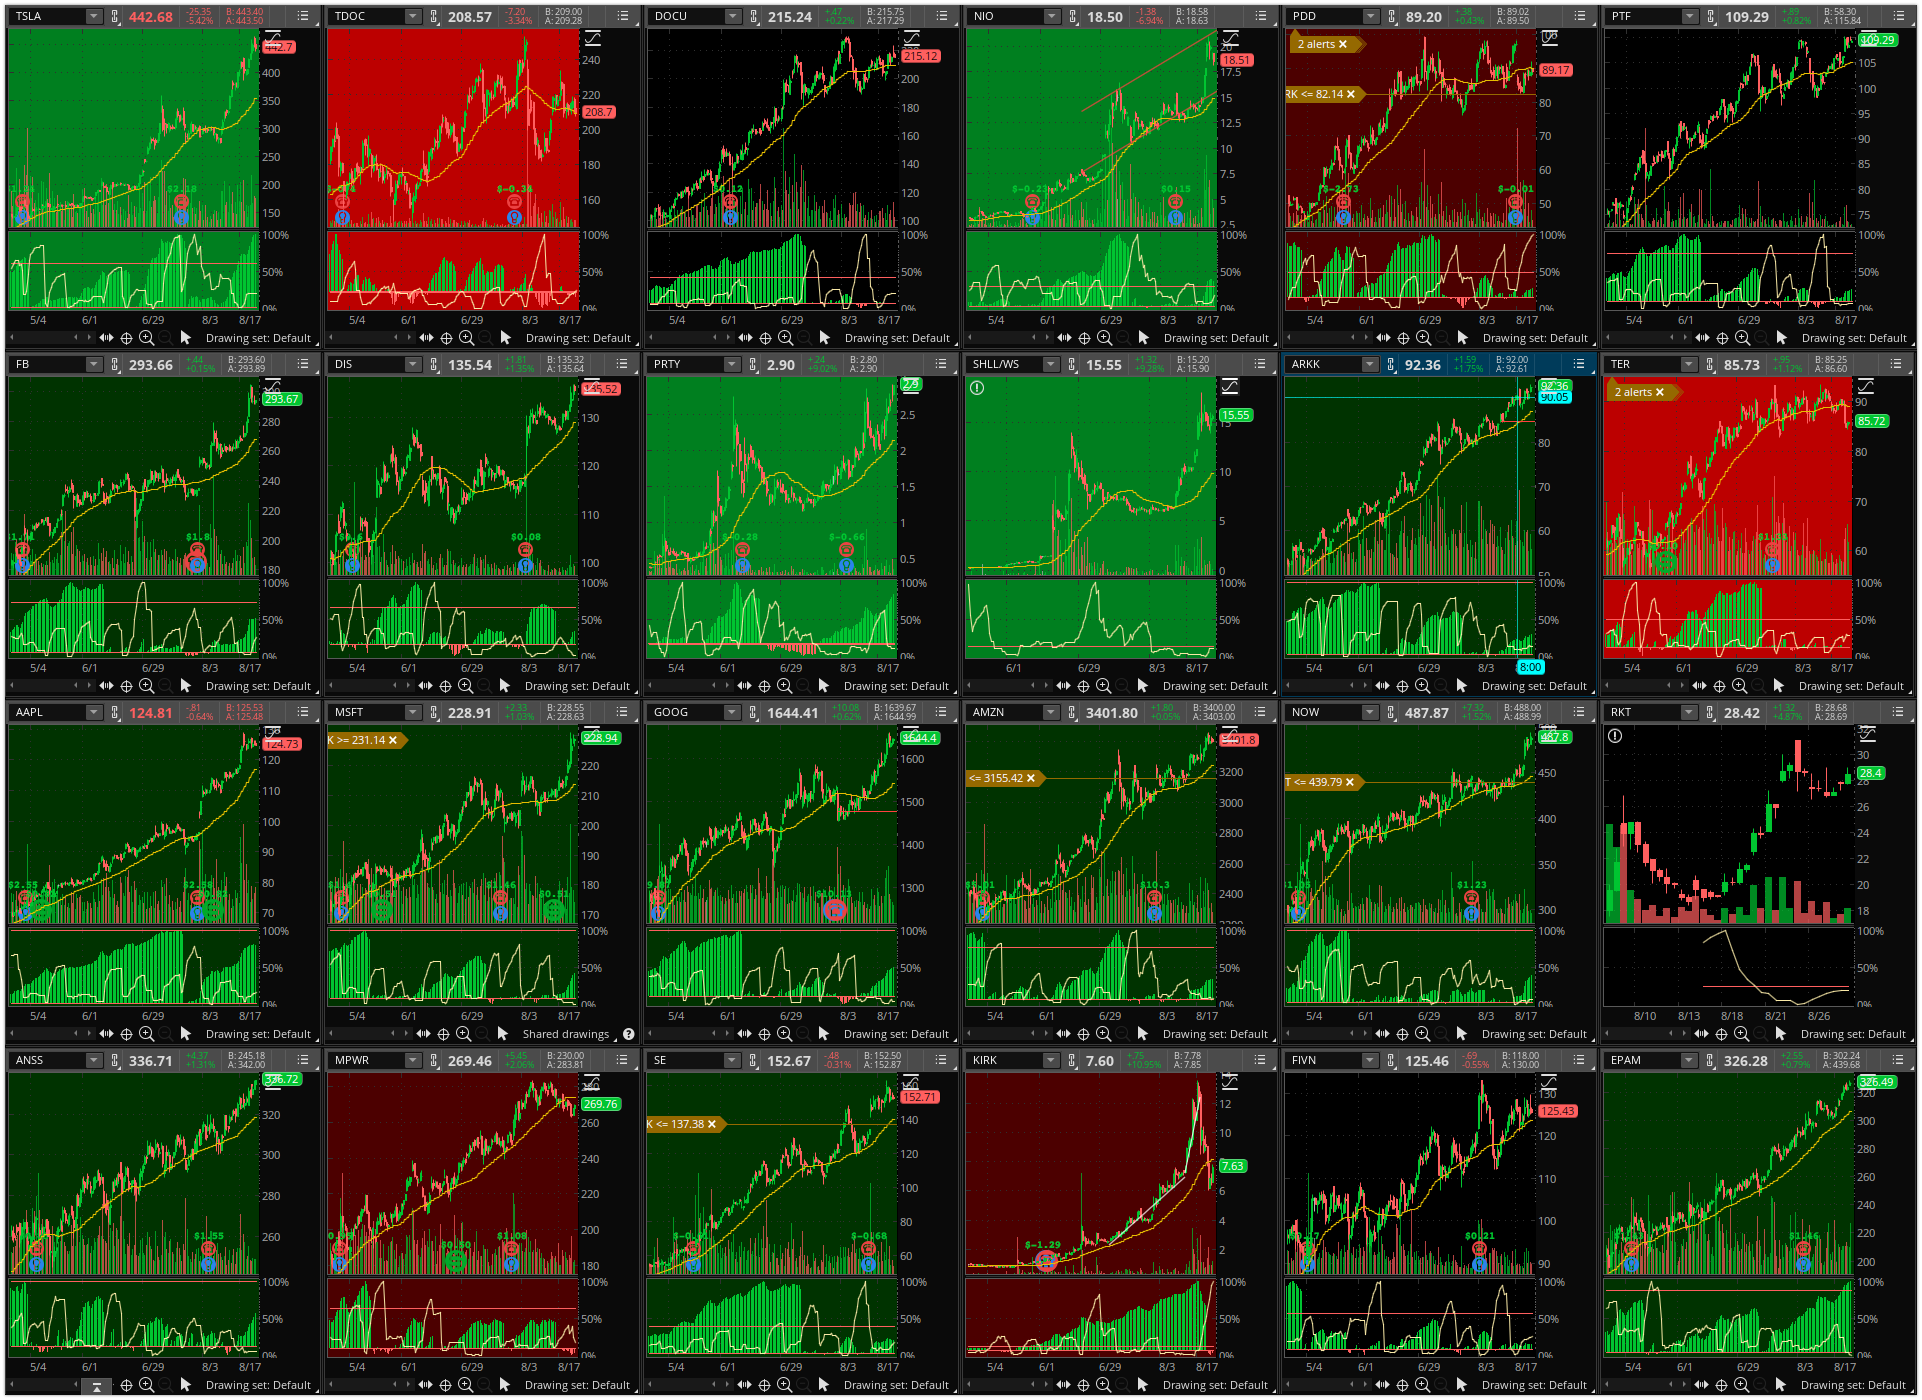
Something like this:

I want to create a ThinkScript that can color the background of the whole chart under a particular current condition. I already got this far:

Something like this:
I want to create a ThinkScript that can color the background of the whole chart under a particular current condition. I already got this far:
Last edited by a moderator:
")