Is this the correct page for the "Impulse" indicator on ThinkorSwim? The one described at this link: https://toslc.thinkorswim.com/center/reference/Tech-Indicators/studies-library/G-L/Impulse
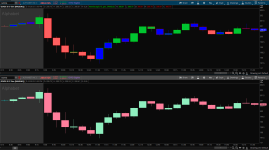
I love this indicator, however, I wanted to see if there is a way to paint only the body of the candle so that the original color of the candle can still be identified by the border. Since the option to distinguish between border and body (fill) exists in "Appearance" under "Chart Settings", I figured there must be a way to accomplish this by adding to the "Impulse" code.
Can anyone please help provide a piece of code that could be added to the following script or edit the script so that either the color of the body/fill of the candle or the border color would change, but NOT both. This way, for example, if the original candle was green/red but was designated neutral/green/red by the indicator, you would still be able to see both the original color as the border or fill AND the repainted color as the border or fill. Hope that makes sense. Please, let me know if you need me to clarify. Thank you for your help!
Code:
#
# Charles Schwab & Co. (c) 2012-2025
#

input length = 13;
input paintBars = yes;

def EMA = ExpAverage(close, length);
def MACD = ExpAverage(close, 12) - ExpAverage(close, 26);
def MACDHist = MACD - ExpAverage(MACD, 9);
def GreenPrice = EMA > EMA[1] and MACDHist > MACDHist[1];
def RedPrice = EMA < EMA[1] and MACDHist < MACDHist[1];

plot Bullish = GreenPrice;
plot Neutral = !GreenPrice and !RedPrice;
plot Bearish = RedPrice;

Bullish.SetDefaultColor(Color.UPTICK);
Bullish.SetPaintingStrategy(PaintingStrategy.BOOLEAN_POINTS);
Bullish.SetLineWeight(3);
Bullish.hide();
Neutral.SetDefaultColor(Color.BLUE);
Neutral.SetPaintingStrategy(PaintingStrategy.BOOLEAN_POINTS);
Neutral.SetLineWeight(3);
Neutral.hide();
Bearish.SetDefaultColor(Color.DOWNTICK);
Bearish.SetPaintingStrategy(PaintingStrategy.BOOLEAN_POINTS);
Bearish.SetLineWeight(3);
Bearish.hide();

DefineGlobalColor("Bullish", Color.UPTICK);
DefineGlobalColor("Neutral", Color.BLUE);
DefineGlobalColor("Bearish", Color.DOWNTICK);
AssignPriceColor(if !paintBars then Color.CURRENT else if GreenPrice then globalColor("Bullish") else if RedPrice then globalColor("Bearish") else globalColor("Neutral"));
Last edited by a moderator: