# vol_avg_x_barcolors
#https://usethinkscript.com/threads/change-candle-color-based-on-its-volume.20937/
#Change Candle color based on its Volume
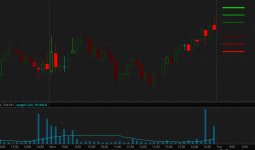
#a bullish candle if the volume is over 1.2x(average 20 day volume)
#a bearish candle if the volume is over 1.2x(average 20 day volume)
#a bullish candle if the volume is over 1.5x(average 20 day volume)
#a bearish candle if the volume is over 1.5x(average 20 day volume)
#All other candles user will define the same color
#ref - colors
#https://usethinkscript.com/threads/an-example-study-to-show-10-shades-of-a-selected-color.15155/
def na = double.nan;
def bn = barnumber();
def x = (!isnan(close) and isnan(close[-1]));
def v = volume;
def isup = (close > open);
def isdwn = (close < open);
# define a price for a few bars after the last bar. baseline for test color lines
def lastcls = if (bn == 1 or x[8]) then 0
else if x[2] then close[2]
else lastcls[1];
input vol_factor1 = 1.2;
input vol_factor2 = 1.5;
input v_avg_len = 20;
def va = Average(v, v_avg_len);
def vfactor = v/va;
DefineGlobalColor("G0", CreateColor(0, 255, 0)); #Green
DefineGlobalColor("G1", CreateColor(0, 229, 0)); #Green
DefineGlobalColor("G2", CreateColor(0, 206, 0)); #Green
DefineGlobalColor("G3", CreateColor(0, 186, 0)); #Green
DefineGlobalColor("G4", CreateColor(0, 167, 0)); #Green
DefineGlobalColor("G5", CreateColor(0, 151, 0)); #Green
DefineGlobalColor("G6", CreateColor(0, 136, 0)); #Green
DefineGlobalColor("G7", CreateColor(0, 122, 0)); #Green
DefineGlobalColor("G8", CreateColor(0, 109, 0)); #Green
DefineGlobalColor("G9", CreateColor(0, 98, 0)); #Green
DefineGlobalColor("R0", CreateColor(255, 0, 0)); #Red
DefineGlobalColor("R1", CreateColor(224, 0, 0)); #Red
DefineGlobalColor("R2", CreateColor(197, 0, 0)); #Red
DefineGlobalColor("R3", CreateColor(174, 0, 0)); #Red
DefineGlobalColor("R4", CreateColor(153, 0, 0)); #Red
DefineGlobalColor("R5", CreateColor(135, 0, 0)); #Red
DefineGlobalColor("R6", CreateColor(118, 0, 0)); #Red
DefineGlobalColor("R7", CreateColor(104, 0, 0)); #Red
DefineGlobalColor("R8", CreateColor( 92, 0, 0)); #Red
DefineGlobalColor("R9", CreateColor( 81, 0, 0)); #Red
# rank vol
def vrank =
if isup and vfactor >= vol_factor2 then 3
else if isup and vfactor >= vol_factor1 then 2
else if isup and vfactor < vol_factor1 then 1
else if isdwn and vfactor >= vol_factor2 then -3
else if isdwn and vfactor >= vol_factor1 then -2
else if isdwn and vfactor < vol_factor1 then -1
else 0;
AssignPriceColor(
if vrank == 3 then GlobalColor("G0")
else if vrank == 2 then GlobalColor("G4")
else if vrank == 1 then GlobalColor("G9")
else if vrank == -1 then GlobalColor("R9")
else if vrank == -2 then GlobalColor("R4")
else if vrank == -3 then GlobalColor("R0")
else color.cyan);
#--------------
# test stuff
# display 6 colored lines after last bar. same colors used on price bars
input test_color_lines = no;
def t1 = lastcls;
def t2 = (0.12/100*lastcls);
#--------------
plot z3 = if test_color_lines and lastcls > 0 then (t1 + (3*t2)) else na;
z3.SetDefaultColor(GlobalColor("g0"));
z3.setlineweight(4);
z3.hidebubble();
plot z2 = if test_color_lines and lastcls > 0 then (t1 + (2*t2)) else na;
z2.SetDefaultColor(GlobalColor("g4"));
z2.setlineweight(4);
z2.hidebubble();
plot z1 = if test_color_lines and lastcls > 0 then (t1 + (1*t2)) else na;
z1.SetDefaultColor(GlobalColor("g9"));
z1.setlineweight(4);
z1.hidebubble();
#--------------
plot z4 = if test_color_lines and lastcls > 0 then (t1 - (1*t2)) else na;
z4.SetDefaultColor(GlobalColor("r9"));
z4.setlineweight(4);
z4.hidebubble();
plot z5 = if test_color_lines and lastcls > 0 then (t1 - (2*t2)) else na;
z5.SetDefaultColor(GlobalColor("r4"));
z5.setlineweight(4);
z5.hidebubble();
plot z6 = if test_color_lines and lastcls > 0 then (t1 - (3*t2)) else na;
z6.SetDefaultColor(GlobalColor("r0"));
z6.setlineweight(4);
z6.hidebubble();
input test_vfactor_bubbles = no;
addchartbubble(test_vfactor_bubbles, low*0.995,
round(vfactor,2)
, color.yellow, no);
#