
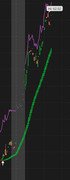
I have a strategy that will signal a change in trend by plotting an up arrow on the chart, indicating an uptrend and a down arrow, indicating a downtrend. Sometimes those signals happen before the market opens. After the market opens the trend could continue in an upward momentum. Any of a dozen trending indicators would be an example. Since I only trade during market hours - is there a way to detect the stock is in this "upward trend" at market open? In essence, the arrow signal has long since past, but I'd still like to catch the momentum at market open. Here's an example of a chart based on a CANDLE_TREND chart. The white arrow is the signal the trend has changed. I'd like to catch that at market open. The images on the right is the effect I'd like to achieve. Thanks


Attachments
Last edited: