I am Investing
New member
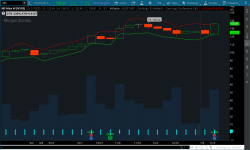
Can someone help me? I want to show the candle closing beyond the defined upper and lower bounds. Why does the script show an arrow on every bar in the chart? And how can I show the arrow on the chart instead of below it? I have attached the script and screen. Thank you.
input length = 14;
input averageType = AverageType.WILDERS;
input BasePeriod = AggregationPeriod.WEEK;
input ATRMultiplier = 2.0;
def pATR = MovingAverage(averageType, TrueRange(high(period = BasePeriod)[1], close(period = BasePeriod)[1], low(period = BasePeriod)[1]), length);
def tATR = MovingAverage(averageType, TrueRange(high(period = BasePeriod)[1], close(period = BasePeriod)[1], low(period = BasePeriod)[1]), length);
def ATR = max(pATR,tATR);
def thisPeriodHigh = high(period = BasePeriod)[0];
def thisPeriodLow = low(period = BasePeriod)[0];
def thisPeriodRange = thisPeriodHigh - thisPeriodLow;
def lastPeriodClose = close(period = BasePeriod)[1];
def hatr = lastPeriodClose + ATR * ATRMultiplier;
def hdtr = thisPeriodLow + ATR * ATRMultiplier;
plot uBound = if hatr < hdtr then hatr else hdtr;
uBound.SetDefaultColor(color = Color.RED);
def latr = lastPeriodClose - ATR * ATRMultiplier;
def ldtr = thisPeriodHigh - ATR * ATRMultiplier;
plot lBound = if latr > ldtr then latr else ldtr;
lBound.SetDefaultColor(color = Color.GREEN);
plot isOver = close(period = BasePeriod) > uBound;
isOver.setpaintingStrategy(paintingStrategy.ARROW_UP);
isOver.setdefaultColor(color.CYAN);
isOver.setlineWeight(1);
plot isUnder = close(period = BasePeriod) < lBound;
isUnder.setpaintingStrategy(paintingStrategy.ARROW_DOWN);
isUnder.setdefaultColor(color.CYAN);
isUnder.setlineWeight(1);

