Beautiful People,
Considering all Keltner channels have a middle moving average, is it possible to use this HMA script for the moving average portion of the Keltner channels and have it go 2x ATR below and above that via Keltner Channels?
First I started with Keltner Channels and trying to add this Adaptive Hull Moving Average script as the moving average, but I could not figure out how to do so. Then I realized maybe I just add Keltner Channels to the Adaptive HMA, maybe that would be easier... but I still cannot get it to work.
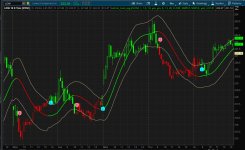
I really just want bands above and below the HMA acting as its potential range, standard deviations or ATR (keltner) would be fine, from there I should be able to figure out whatever anyone comes up with.
Really appreciate the help and insight as always.
Considering all Keltner channels have a middle moving average, is it possible to use this HMA script for the moving average portion of the Keltner channels and have it go 2x ATR below and above that via Keltner Channels?
First I started with Keltner Channels and trying to add this Adaptive Hull Moving Average script as the moving average, but I could not figure out how to do so. Then I realized maybe I just add Keltner Channels to the Adaptive HMA, maybe that would be easier... but I still cannot get it to work.
I really just want bands above and below the HMA acting as its potential range, standard deviations or ATR (keltner) would be fine, from there I should be able to figure out whatever anyone comes up with.
Really appreciate the help and insight as always.
Code:
#// @Loxx
#indicator('PA-Adaptive Hull Parabolic [Loxx]', overlay=true)
# Converted by Sam4Cok@Samer800    - 12/2023
input src = close;#, "Source", group = "Basic Settings")
input Power = 1;#, "Power", group = "Basic Settings")
input PhaseAccumulationCycles = 1.0;#, "Phase Accumulation Cycles", group = "Basic Settings")
input PhaseAccumulationPower = 1.0;#, "Phase Accumulation Power", group = "Basic Settings")
input colorBars = yes;#(true, "Color bars", group= "UI Options")
input showSigs = yes;#(true, "Show signals", group= "UI Options")

def na = Double.NaN;
#calcComp(src, period)=>
Script calcComp {
input src = close;
    def out = (
         (0.0962 * src +
         0.5769 * src[2] -
         0.5769 * src[4] -
         0.0962 * src[6]) * (0.075 * src[1] + 0.54));
    plot return = out;
}
#iLwmp(src, len, pow) =>
script iLwmp {
    input src = close;
    input len1 = 10;
    input pow = 1;
    def len = if len1 < 2 then 2 else len1;
    def sumw_ = Power(len, pow);
    def sum_ = sumw_ * src;
    def sum1 = fold i = 1 to len with q=sum_ do
               q + Power(len - i, pow) * GetValue(src, i);
    def sumw1 = fold k = 1 to len with p=sumw_ do
               p + Power(len - k, pow);
    def sum = sum1;
    def sumw = sumw1;
    def iLwmp = sum / sumw;
    plot out = if isNaN(iLwmp) then (sum_/sumw_) else iLwmp;
}
#export paa(float src, float mult, float filt)=>
script paa {
    input src = close;
    input mult = 1;
    input filt = 0;
    def bar_index = AbsValue(BarNumber());
    def pi = Double.Pi;
    def degree = 180.0 / pi;
    def filter = Max(filt, 1);
    def I1;
    def Q1;
    def Phase;
    def period;
    def Smooth = if bar_index > 5 then
                 (4 * src + 3 * src[1] + 2 * src[2] + src[3]) / 10 else Smooth[1];
    def ts = calcComp(Smooth);
    def Detrender = if bar_index > 5 then ts else Detrender[1];
    def qs = calcComp(Detrender);
    def Q1_ = if bar_index > 5 then qs else Q1[1];
    def I1_ = if bar_index > 5 then Detrender[3] else I1[1];
        I1 = 0.15 * I1_ + 0.85 * I1[1];
        Q1 = 0.15 * Q1_ + 0.85 * Q1[1];
    def Phase1 = Phase[1];
    def Phase2 = if AbsValue(I1) > 0 then degree * ATan(AbsValue(Q1 / I1)) else Phase1;
    def Phase3 = if I1 < 0 and Q1 > 0 then 180 - Phase2 else Phase2;
    def Phase4 = if I1 < 0 and Q1 < 0 then 180 + Phase3 else Phase3;
        Phase  = if I1 > 0 and Q1 < 0 then 360 - Phase4 else Phase4;
    def DeltaPhase1 = Phase[1] - Phase;
    def DeltaPhase2 = if Phase[1] < 90 and Phase > 270 then
                      360 + Phase[1] - Phase else DeltaPhase1;
    def DeltaPhase3 = Max(Min(DeltaPhase2, 60), 7);
    def DeltaPhase = DeltaPhase3;
    def PhaseSum;
    def preSum;
    def count;
    if (PhaseSum[1] < (mult * 360) and count[1] < 4500) {
        preSum = GetValue(DeltaPhase, count[1]);
        PhaseSum = PhaseSum[1] + (if isNaN(preSum) then 0 else preSum);
        count = count[1] + 1;
    } else {
        preSum = 0;
        PhaseSum = PhaseSum[1];
        count = 0;
    }
    def InstPeriod = if count > 0 then count else InstPeriod[1];
    def alpha = 2.0 / (1.0 + filter);
    def period1 = period[1] + alpha * (InstPeriod - period[1]);
        period = if Floor(period1) < 1 then 1 else Floor(period1);
    def paa = Floor(period);
    plot return = if isNaN(paa) then 1 else paa;
}
def paa_ = paa(src, PhaseAccumulationCycles, PhaseAccumulationPower);
def HmaLength = if paa_ < 2 then 2 else paa_;
def HalfPrd    = HmaLength / 2;
def HullPrd    = Sqrt(HmaLength);
def HalfPeriod = Floor(HalfPrd);
def HullPeriod = Floor(HullPrd);
def iLwmpHalf_ = iLwmp(src, HalfPeriod, Power);
def iLwmpHma_  = iLwmp(src, HmaLength, Power);
def iLwmpHalf  = iLwmpHalf_;
def iLwmpHma = iLwmpHma_;
def iLwmSrc  = (2.0 * iLwmpHalf) - iLwmpHma;
def hullout_ = iLwmp(iLwmSrc, HullPeriod, Power);
def hullout = hullout_;
def sig = hullout[1];
def colorout = hullout > sig;
def goLong  = Crosses(hullout, sig, CrossingDirection.ABOVE);
def goShort = Crosses(hullout, sig, CrossingDirection.BELOW);

AssignPriceColor(if !colorBars then Color.CURRENT else
                 if colorout then Color.GREEN else Color.RED);

plot hullLine = hullout;
hullLine.SetLineWeight(2);
hullLine.AssignValueColor(if colorout then Color.GREEN else Color.RED);

AddChartBubble(goLong, low, "L", Color.CYAN, no);
AddChartBubble(goShort, high, "S", GetColor(2));

#-- END of CODE