Bulkowski's Downside Weekly Reversal for ThinkorSwim

BenTen

Administrative
Staff member
Staff
VIP
Lifetime
This is an interesting one; it's called Bulkowski's Downside Weekly Reversals. Meant to be used on the weekly chart.
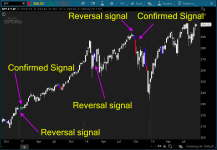
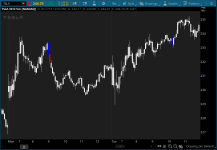
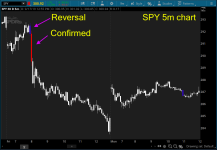
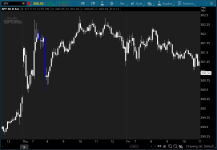
Blue candle represent reversal signal. There will be a green or red candle after the blue candle to confirm the direction.
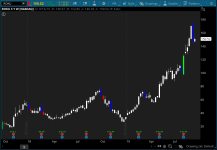
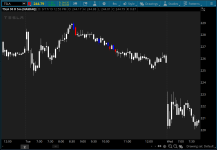
Some examples:

Lj0pqmd.png

oiGQQ7i.png


1vIV3oe.png

rl9F9ho.png

9BwQkes.png

bF3gtlK.png


As the name suggested, this is a downside reversal indicator. So you will often find more bearish signals than bullish signals.

Although it was recommended and designed for the weekly chart, you can use this indicator on any timeframe. Some provides excellent opportunity for swing trading and day trading. For swing traders, I would look at the weekly (duh!), daily, and hourly charts. For day traders, I would look at the hourly going all the way to the 5 minutes chart.

thinkScript Code

Code:
# Bulkowski's Downside Weekly Reversal
# Assembled by BenTen at useThinkScript.com
# Converted from https://www.tradingview.com/script/6gvr4rDR-Downside-Weekly-Reversal/

def weekly_reversal = high > high[1] and close<low[1] and open> open[1];
def breakout_up = high[1] > high[2] and close[1] < low[2] and open[1] >open[2] and close > high[1];
def breakout_down = high[1] > high[2] and close[1] < low[2] and open[1] >open[2] and close<low[1];

assignPriceColor(if weekly_reversal then Color.Blue else if breakout_up then color.green else if breakout_down then color.red else color.white);
 

Attachments

  • Lj0pqmd.png
    Lj0pqmd.png
    136 KB · Views: 114
  • oiGQQ7i.png
    oiGQQ7i.png
    72.7 KB · Views: 124
  • 1vIV3oe.png
    1vIV3oe.png
    90.8 KB · Views: 110
  • rl9F9ho.png
    rl9F9ho.png
    77.2 KB · Views: 120
  • 9BwQkes.png
    9BwQkes.png
    66.2 KB · Views: 128
  • bF3gtlK.png
    bF3gtlK.png
    66 KB · Views: 120
@BenTen have you backtested this one? looks nice. Is there anyway to add an alert on this study? Thanks
 
Last edited by a moderator:
@BenTen is there anyway to add an alert on this study? Thanks
@Billions - https://tos.mx/KAIkaOM

Code:
#Alert
def alerttrigger1 = weekly_reversal;

input alerttext = "!!!!!! Bulkowski's Reversal !!!!!";

input UseAlerts = {false, default true};

input AlertType = {default "BAR", "ONCE", "TICK"};

def at = AlertType;

input AlertSound = {"Chimes", "Ring", default "Bell", "NoSound", "Ding"};

Alert (alerttrigger1 and UseAlerts, alerttext, if at == 1 then Alert.ONCE else if at == 2 then Alert.TICK else Alert.BAR, AlertSound);
 
Last edited by a moderator:
@BenTen Nice Indicator looks like its only working for few stocks accurately. In 5min or weekly where there is reversal why no Green candle not formed? any other script need to be added for that?

i'll test it anyway tomorrow for 5min candle how it goes for NFLX/ANTM .
 
@raghavag2004 The blue candle is a warning for potential reversal followed by a green or red candle to confirm the trend. If there is no green or red, then the trend has not been confirmed. Depending on whether you're a conservative or aggressive trader, you may choose to take the trade right after the blue candle or wait for the confirmation candle.
 
@Playstation Here you go

Code:
# Bulkowski's Downside Weekly Reversal
# Assembled by BenTen at useThinkScript.com
# Converted from https://www.tradingview.com/script/6gvr4rDR-Downside-Weekly-Reversal/

def weekly_reversal = high > high[1] and close<low[1] and open> open[1];
def breakout_up = high[1] > high[2] and close[1] < low[2] and open[1] >open[2] and close > high[1];
def breakout_down = high[1] > high[2] and close[1] < low[2] and open[1] >open[2] and close<low[1];

assignPriceColor(if weekly_reversal then Color.Blue else if breakout_up then color.green else if breakout_down then color.red else color.white);

# Plot Confirmed Signals
plot bullish = breakout_up;
bullish.SetPaintingStrategy(PaintingStrategy.BOOLEAN_ARROW_UP);
bullish.SetDefaultColor(Color.CYAN);
bullish.SetLineWeight(1);
plot bearish = breakout_down;
bearish.SetPaintingStrategy(PaintingStrategy.BOOLEAN_ARROW_DOWN);
bearish.SetDefaultColor(Color.CYAN);
bearish.SetLineWeight(1);
 
@BenTen Scanner is not working for some reason. Alert doesn't pop up for SPY/SPX. I did some tests on TOS Demand. Could you please advise if any changes can be made to this script. I combined the scripts you posted for Alerts + Scan. Looking for email/alert on the Warning phase.

Thank you.
 
@veerasareddy Try this for the alerts:

Code:
Alert(breakout_up, " ", Alert.Bar, Sound.Chimes);
Alert(breakout_down, " ", Alert.Bar, Sound.Bell);
 
This is a great indictor I use it for shorts as I trade off the daily this indicator will alert down to the 15min and up. When I find a ticker to short switch over to this and ride it down.
 
s
@Billions No adjustments. If there was any I will always mention it in the original thread.
Ben I discovered something today that may be of interest, I dont understand it. While using this indicator I set my time frame to 3min and changed the candle type to HEIKIN ASHI and bam I see a tradeable signal where it did not exist set as candle? see todays DE on 3min chart.. all red divergents well majorly show bulloski on 3 min just tried tgt. This would have been a game changer for me today shorting DE..... way cool
 
  • Like
Reactions: ALF
Is there a way to set up a scan for this? I've tried the route that I have previously used for scans in the past and this time a around it's not working. The study isn't displaying any options to select in the wizard.
 
Hi BenTen, thank you for share this indicator with us.. a quick question, do you have the scan for the indicator? thank you very much and keep up the good job
 
Hi BenTen, thank you for share this indicator with us.. a quick question, do you have the scan for the indicator? thank you very much and keep up the good job
To create the scan script, edit the 'def' to 'plot' in the statement you are scanning for.
 

Join useThinkScript to post your question to a community of 21,000+ developers and traders.

Similar threads

Not the exact question you're looking for?

Start a new thread and receive assistance from our community.

87k+ Posts
507 Online
Create Post

Similar threads

Similar threads

The Market Trading Game Changer

Join 2,500+ subscribers inside the useThinkScript VIP Membership Club
  • Exclusive indicators
  • Proven strategies & setups
  • Private Discord community
  • ‘Buy The Dip’ signal alerts
  • Exclusive members-only content
  • Add-ons and resources
  • 1 full year of unlimited support

Frequently Asked Questions

What is useThinkScript?

useThinkScript is the #1 community of stock market investors using indicators and other tools to power their trading strategies. Traders of all skill levels use our forums to learn about scripting and indicators, help each other, and discover new ways to gain an edge in the markets.

How do I get started?

We get it. Our forum can be intimidating, if not overwhelming. With thousands of topics, tens of thousands of posts, our community has created an incredibly deep knowledge base for stock traders. No one can ever exhaust every resource provided on our site.

If you are new, or just looking for guidance, here are some helpful links to get you started.

What are the benefits of VIP Membership?
VIP members get exclusive access to these proven and tested premium indicators: Buy the Dip, Advanced Market Moves 2.0, Take Profit, and Volatility Trading Range. In addition, VIP members get access to over 50 VIP-only custom indicators, add-ons, and strategies, private VIP-only forums, private Discord channel to discuss trades and strategies in real-time, customer support, trade alerts, and much more. Learn all about VIP membership here.
How can I access the premium indicators?
To access the premium indicators, which are plug and play ready, sign up for VIP membership here.
Back
Top