This is an interesting one; it's called Bulkowski's Downside Weekly Reversals. Meant to be used on the weekly chart.
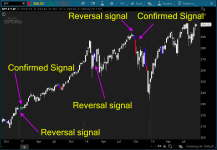
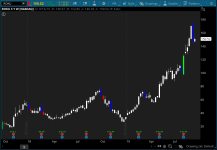
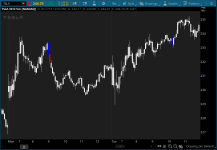
Some examples:


As the name suggested, this is a downside reversal indicator. So you will often find more bearish signals than bullish signals.
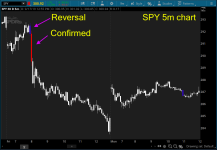
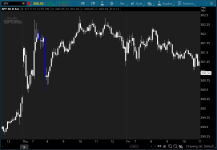
Although it was recommended and designed for the weekly chart, you can use this indicator on any timeframe. Some provides excellent opportunity for swing trading and day trading. For swing traders, I would look at the weekly (duh!), daily, and hourly charts. For day traders, I would look at the hourly going all the way to the 5 minutes chart.
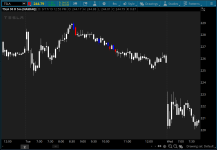
Blue candle represent reversal signal. There will be a green or red candle after the blue candle to confirm the direction.
Some examples:
As the name suggested, this is a downside reversal indicator. So you will often find more bearish signals than bullish signals.
Although it was recommended and designed for the weekly chart, you can use this indicator on any timeframe. Some provides excellent opportunity for swing trading and day trading. For swing traders, I would look at the weekly (duh!), daily, and hourly charts. For day traders, I would look at the hourly going all the way to the 5 minutes chart.
thinkScript Code
Code:
# Bulkowski's Downside Weekly Reversal
# Assembled by BenTen at useThinkScript.com
# Converted from https://www.tradingview.com/script/6gvr4rDR-Downside-Weekly-Reversal/

def weekly_reversal = high > high[1] and close<low[1] and open> open[1];
def breakout_up = high[1] > high[2] and close[1] < low[2] and open[1] >open[2] and close > high[1];
def breakout_down = high[1] > high[2] and close[1] < low[2] and open[1] >open[2] and close<low[1];

assignPriceColor(if weekly_reversal then Color.Blue else if breakout_up then color.green else if breakout_down then color.red else color.white);
