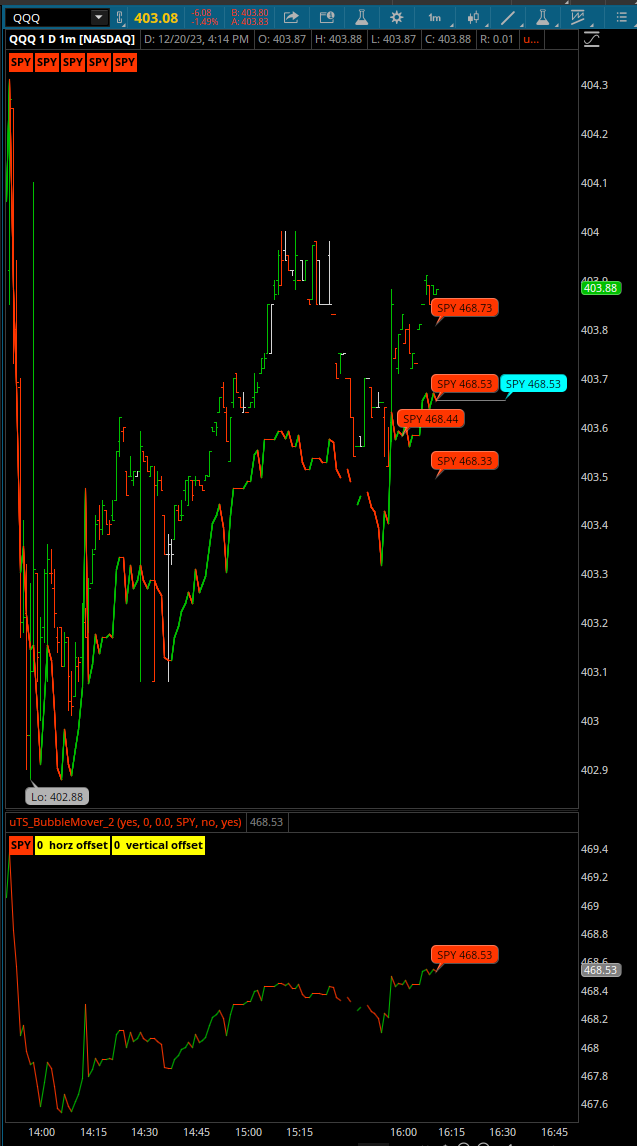
uTS has good posts/threads on the Bubble Mover issue but I was not able to find a solution for a referenced symbol with it's value included in the bubble.
I am looking for 3 Inputs to control viewing of the Bubble Mover and it's Horizontal and Vertical positions from the Edit Studies and Strategies window.
Edit: removed == Yes from AddChartBubble(Bubble == Yes
This is what I was able to create so far and am now seeking assistance on the movement problem:
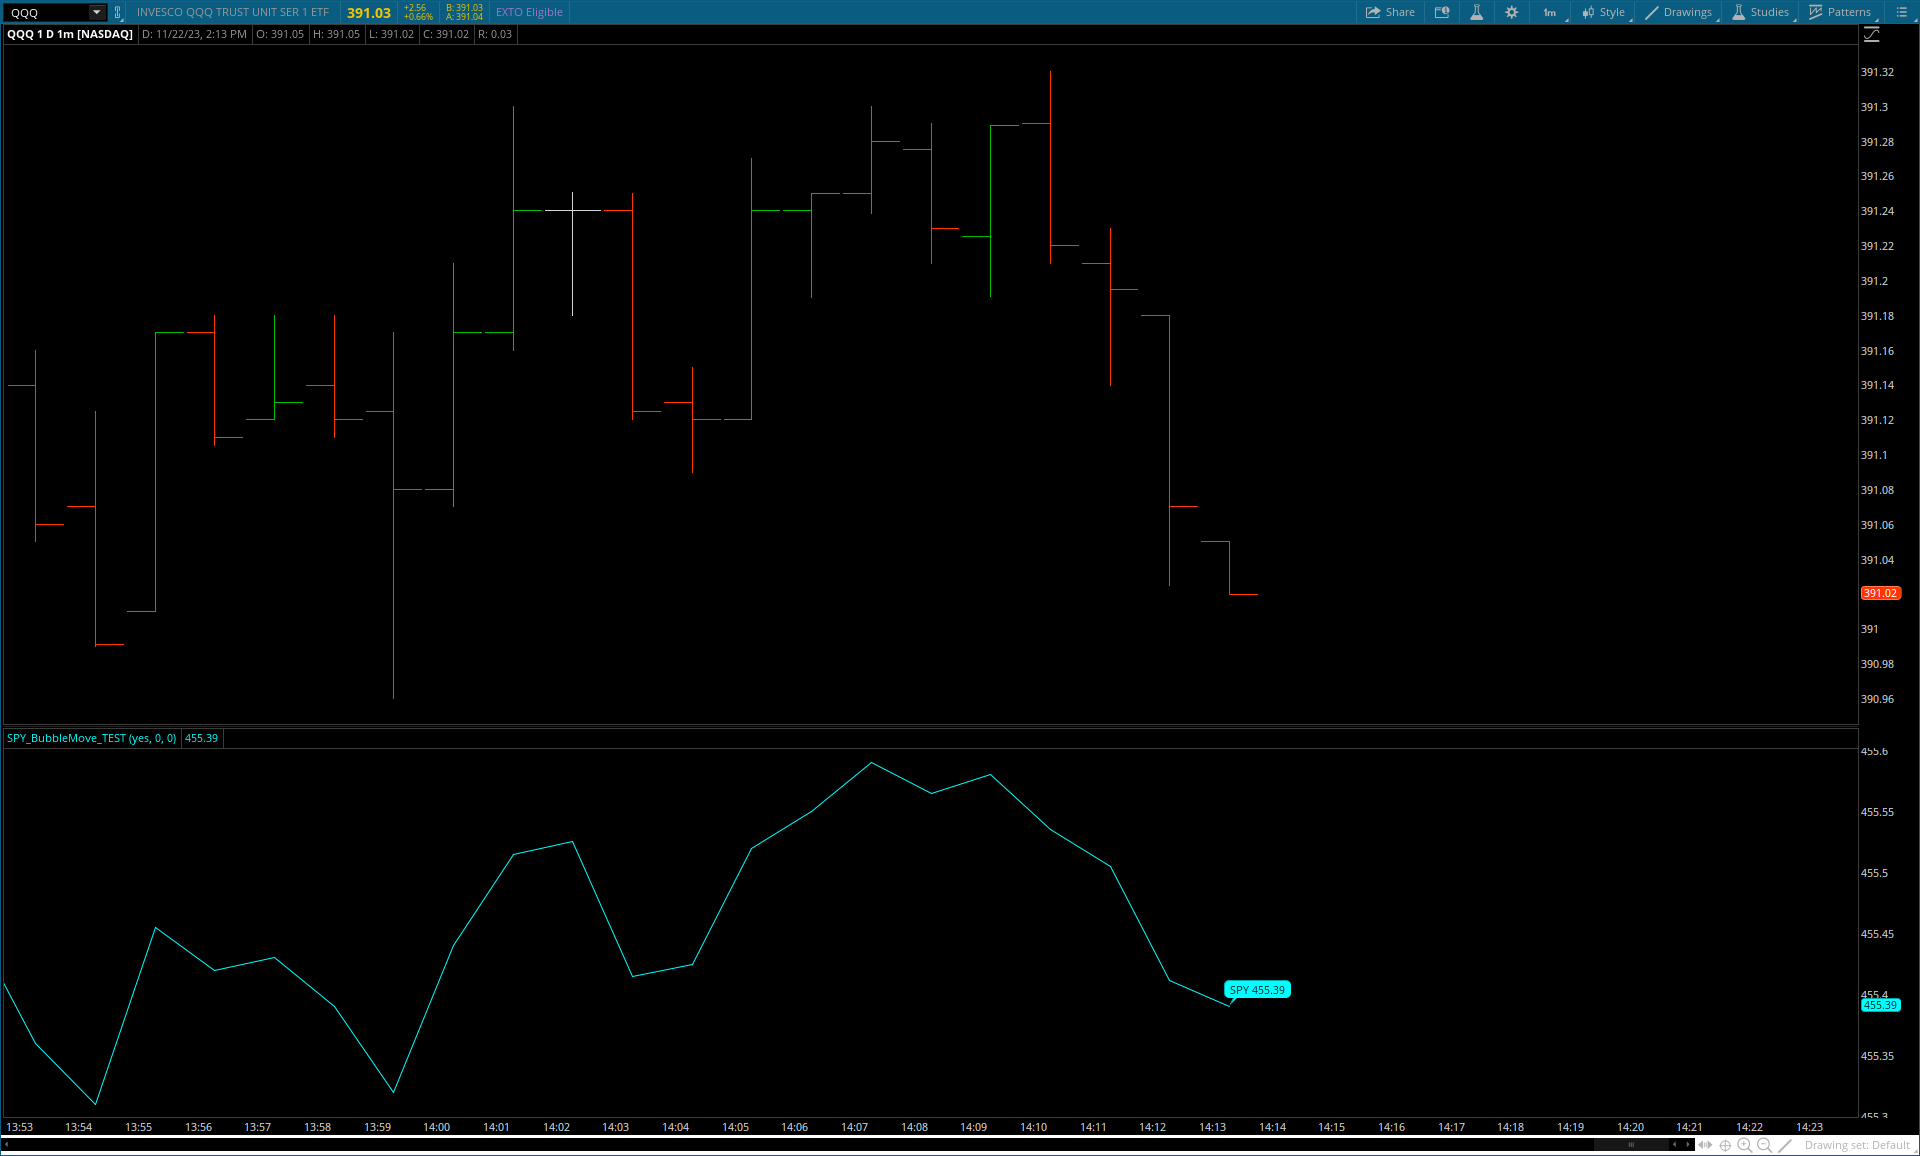
Code:
declare lower;

input Bubble      = No;
input bubbleMoveH = 0; # Move Horizontal
input bubbleMoveV = 0; # Move Vertical

def Symbol = close("SPY");

plot Sym = Symbol;

def Data = if IsNaN(close[-1]) then Sym else Double.NaN;

def bMH  = bubbleMoveH;
def bMH1 = bMH + 1;
def bMV  = bubbleMoveV;

AddChartBubble(Bubble and isNaN(close[-1]) and !isNaN(close),
 Data, "SPY " + Round(Data,2),
 Sym.TakeValueColor());
Last edited: